Price Action
-
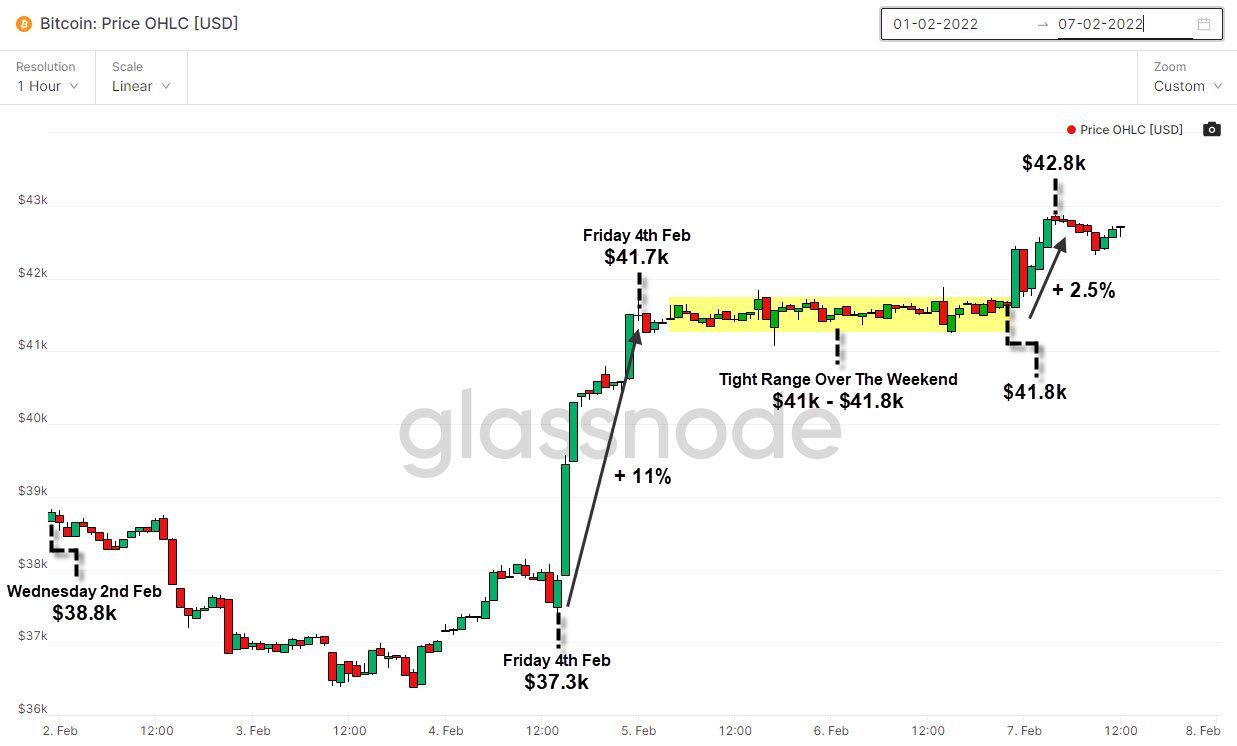
The Crypto Market saw two rallies at the beginning and end of the weekend
-
Bitcoin led these rallies due to a fresh inflow of USD
- BTC jumped 11% on Friday to $41.7k
- Proceeded to trade in a tight channel over the weekend
- Jumped again by 2.5% Sunday evening to reach $42.8k
-
Unique price action YTD as Bitcoin was uncorrelated to the equity market
On-Chain Analysis
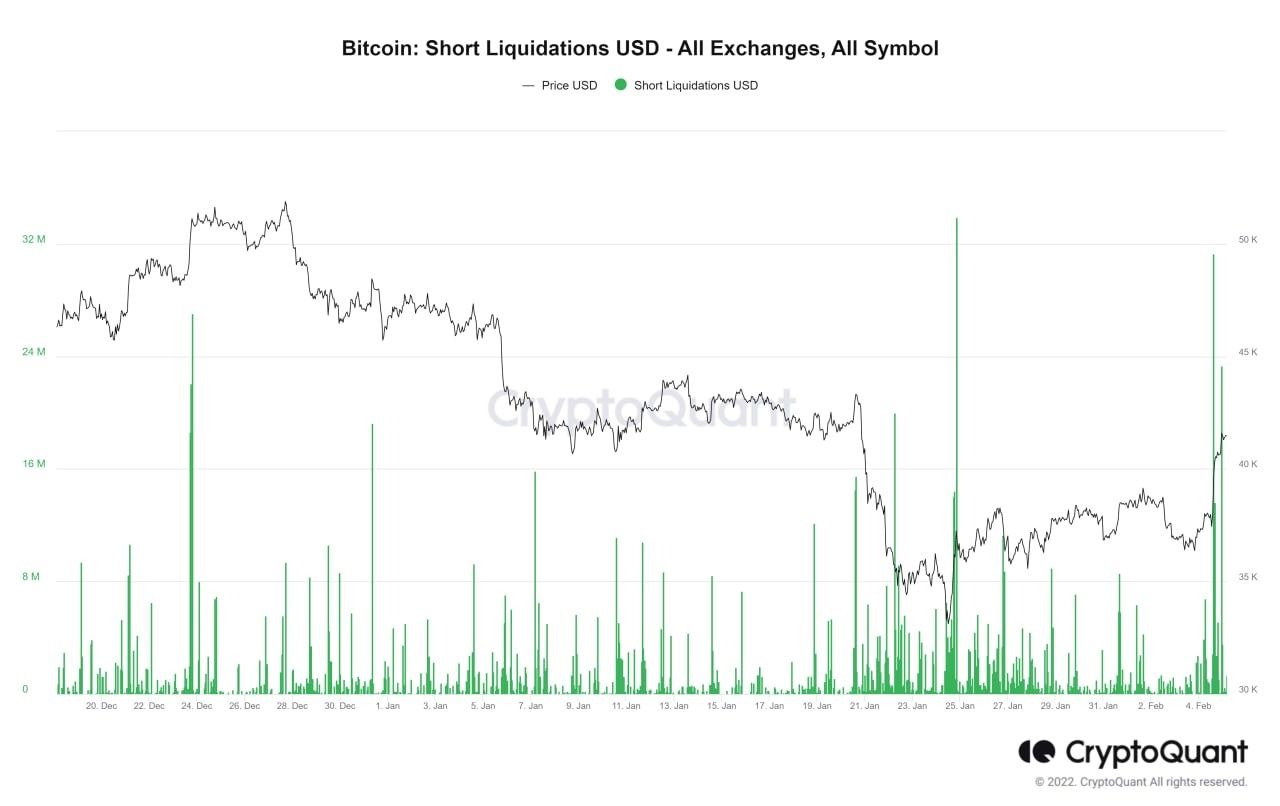
$87.1M Worth of Short Positions Liquidated on February 4th
- Sudden 11% increase in BTC caused the liquidation of short positions
- These liquidations added further upward pressure to price, causing a significant squeeze of shorts
Bitcoin Futures Perpetual Funding Rate
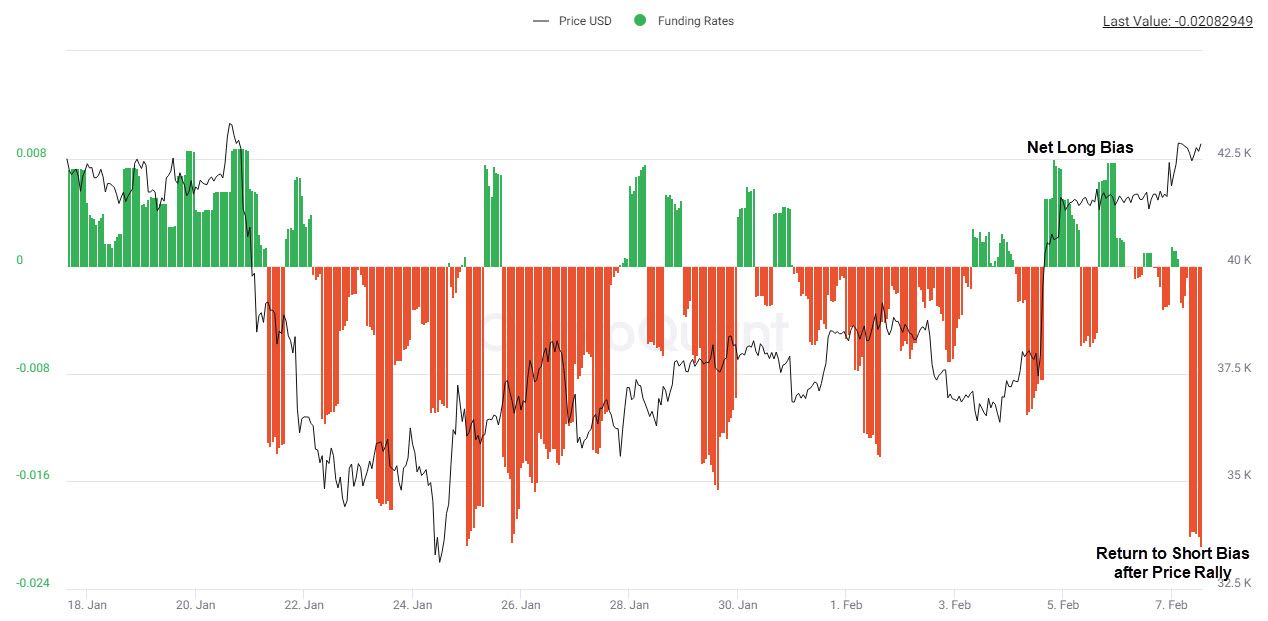
- Last two weeks have seen consistent net short bias
- Bias flipped to long after the 11% price rally on February 4th
- Traders have switched to a net short bias again
Derivatives traders seem to expect prices to dip from here and for the bear market to continue
Spent Output Profit Ratio (SOPR)
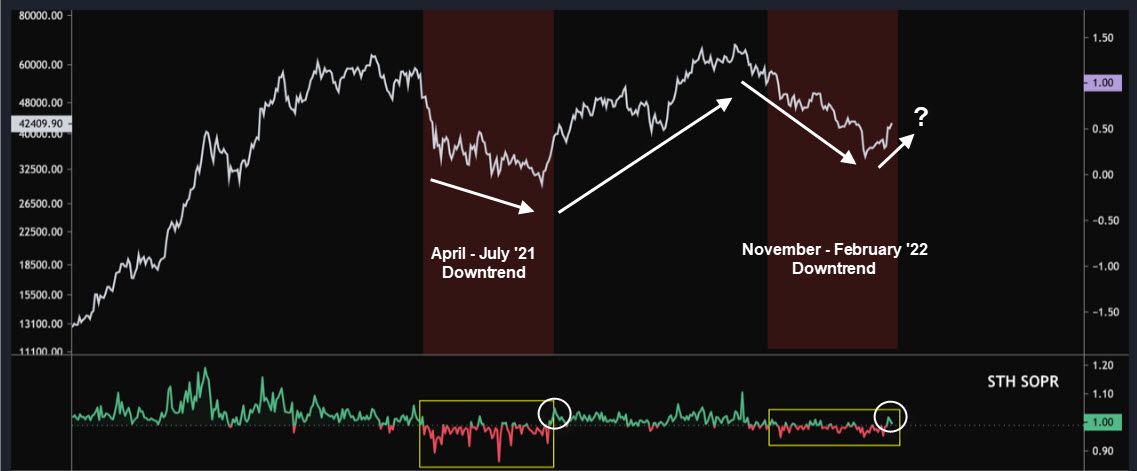
- SOPR describes the profitability of investors in the BTC market
- The metric is used as an indicator of downtrending and uptrending markets
- The metric trended in the red since prices dropped from the November all-time highs (ATH) much like in May, June and July of 2021 as indicated in red on the graph below
- The metric has crossed over into the green again with the rally on February the 4th, which can be a potential indicator of a reversal in the price trend
14-day Market Realised Gradient
The delta gradient infers the direction and magnitude of momentum in the Bitcoin Market.
We observed a bearish divergence during the 2021 Bull run:
- Prices were making higher highs
- Delta gradient (purple line) was making lower lows
We can observe a potential bullish divergence currently:
- Prices have been decreasing since reaching an ATH in November
- Momentum (delta gradient) has been increasing during the same period
- We saw a significant break above 0 ** with the Delta Gradient (purple line) with the recent rally on February 4th
** 0 is the line denoted in red and indicates neutral momentum. Values above 0 indicate upward momentum and vice versa when values are below 0
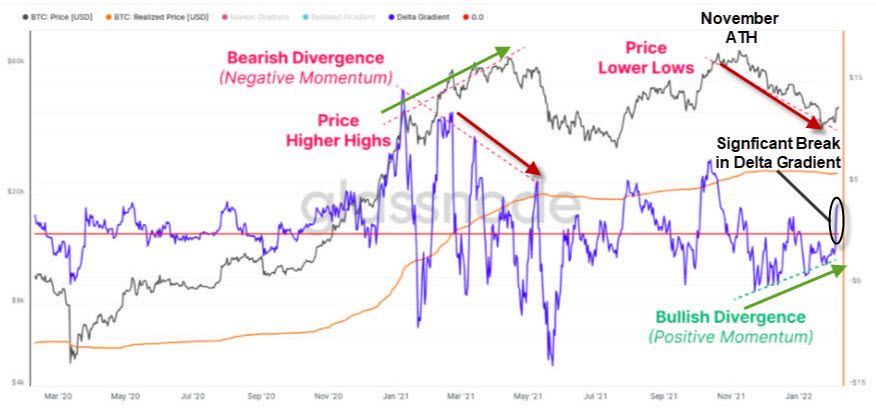
The market is pushing higher as momentum is increasingly positive. We could see a potential swing higher in prices over the next two weeks.


