- BTC gains 8.9% in a week in part due to a cautious FOMC
- Higher likelihood of a continued price uptrend according to various indicators
- Increased activity and implied volatility in futures and options markets respectively
- Available BTC supply continues to decrease
Weekly Price Action
- BTC is currently trading at $44'446
- The weekly return was +8.9%
- Price action moved in a step-like pattern
- A more cautious FOMC contributed to a rapid 4.7% increase in price
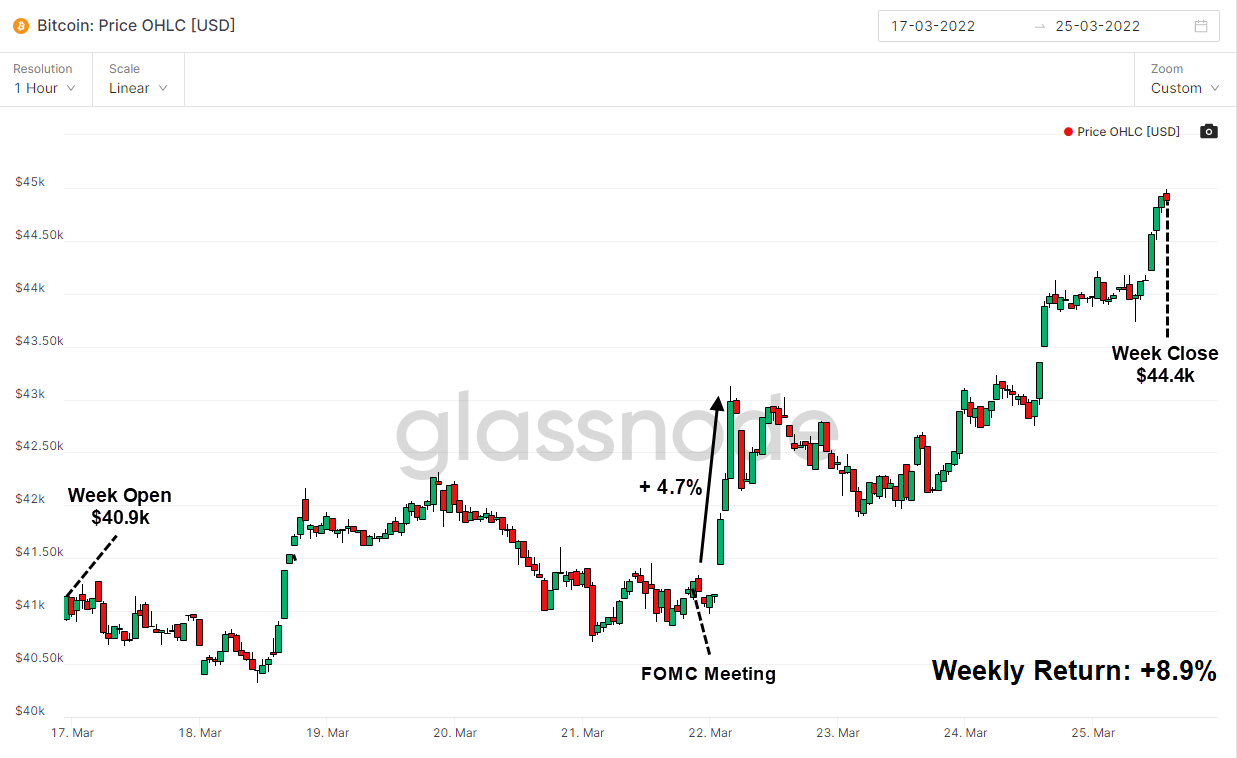
Cautious Fed pushes BTC higher
- The Federal Open Market Committee's (FOMC) exhibited a hawkish attitude toward monetary policy as they increased interest rates in the US by 0.25% on March 16th
- The overall consensus of the FOMC's meeting on Wednesday was less hawkish as they claimed that six more rate hikes are expected for the year which is unlikely to entirely curb rising inflation which currently stands at 7.9%
- BTC price increased by a significant 4.7% in four hours as such
Analytics suggest continued uptrend
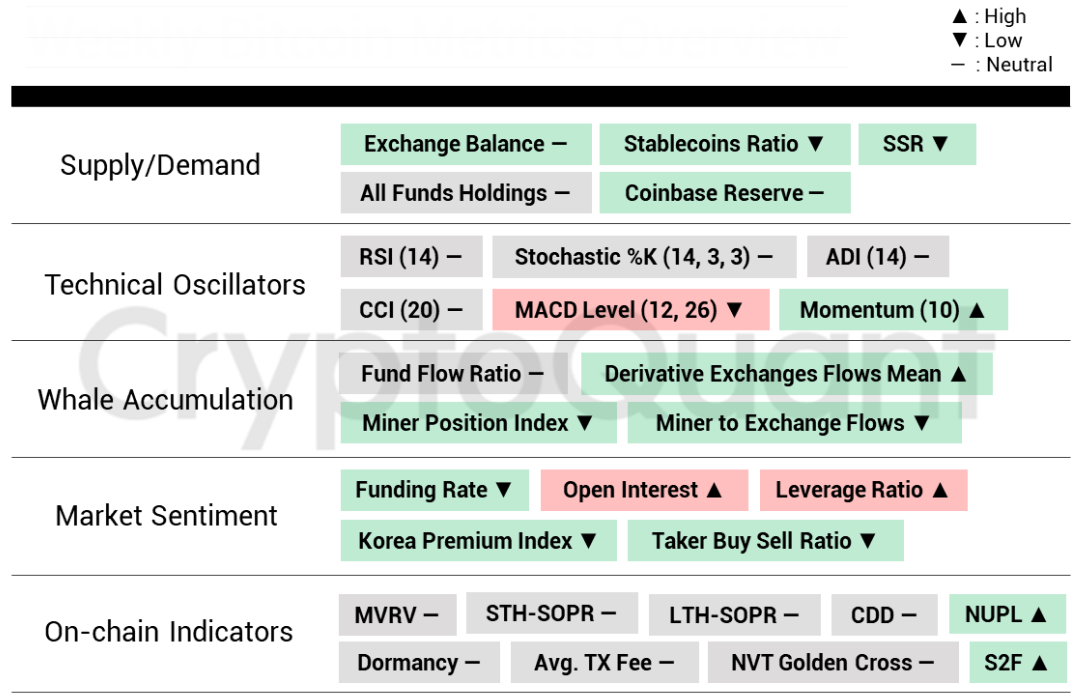
- These are weekly indicators spanning multiple metrics compiled by CryptoQuant
- They suggest that Bitcoin's price is more likely to increase than not over the next week as more indicators are in green than red
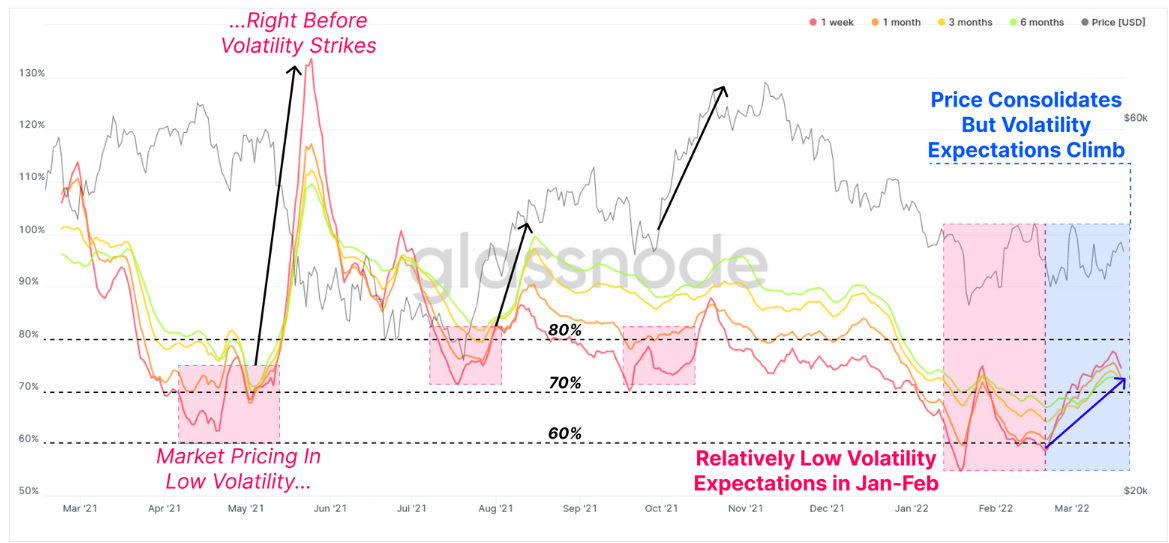
Higher Volatility Priced in Derivatives markets
Options ATM Volatility - Deribit Exchange
- This metric shows the ATM implied volatility (IV) for options contracts expiring 1 week, 1 month, 3 months, and 6 months from today
- IV tends to be low during periods with sideway price action
- IV has increased in recent weeks despite sideway price action
- This highlights the uniqueness of the current macro environment (Ukraine war, high inflation, COVID)
- Periods of low IV followed by an increase in IV have lead to major price movements in the last year (May 2021 Crash, Oct. 2021 Bull run)
Increased Activity in Futures Markets
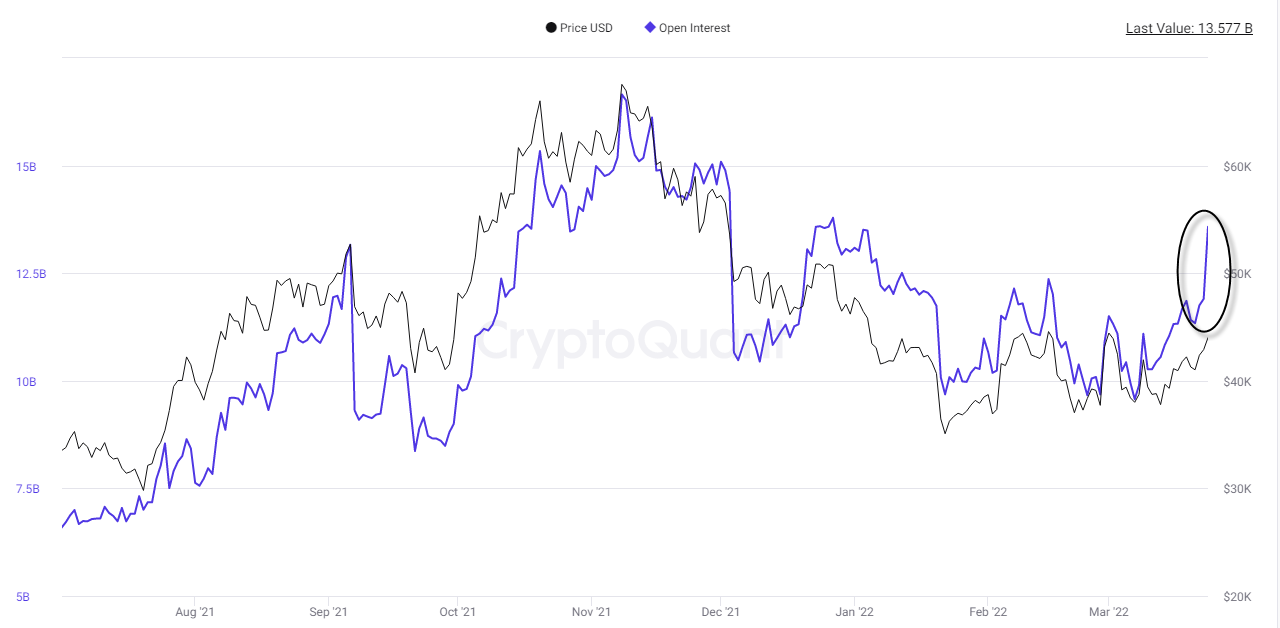
Futures Open Interest - All Exchanges
- This metric illustrates the amount of open futures contracts for Bitcoin
- Open Interest has increased significantly in the last week
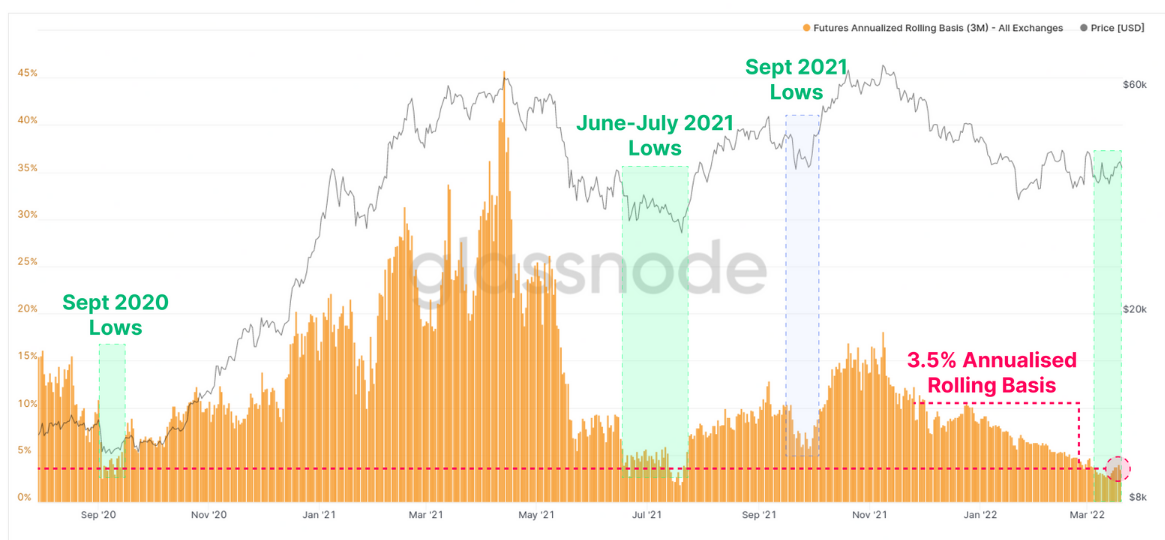
Futures Annualized Rolling Basis (3M) - All Exchanges
- This metric measures the annualized yield (percent return) that can be had by buying BTC spot and simultaneously selling a BTC futures contract that expires in 3 months
- The 3-month annualized rolling basis has dropped to 3.5% because of the recent increase in demand for futures contracts
- This level marked a bottom in price the last times it was reached (Sept. 2020 & July 2021)
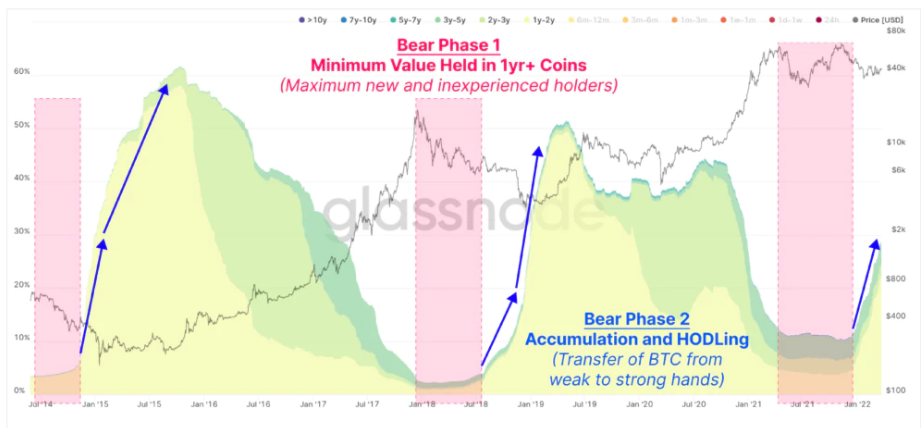
Supply Matures Increasingly
Realised Cap HODL Waves (Coins > 1yr)
- This metric bundles all active supply age bands older than 1 year, with each colored band showing the percentage of Bitcoin in existence that was last moved within the time period denoted in the legend, weighted by realised capitalization
- The supply of + 1yr old coins continues to rise sharply since January 2022
- High levels of such supply has lead to new all-time highs historically
- The current trend in the metric is similar to the second phase of the historic pattern
