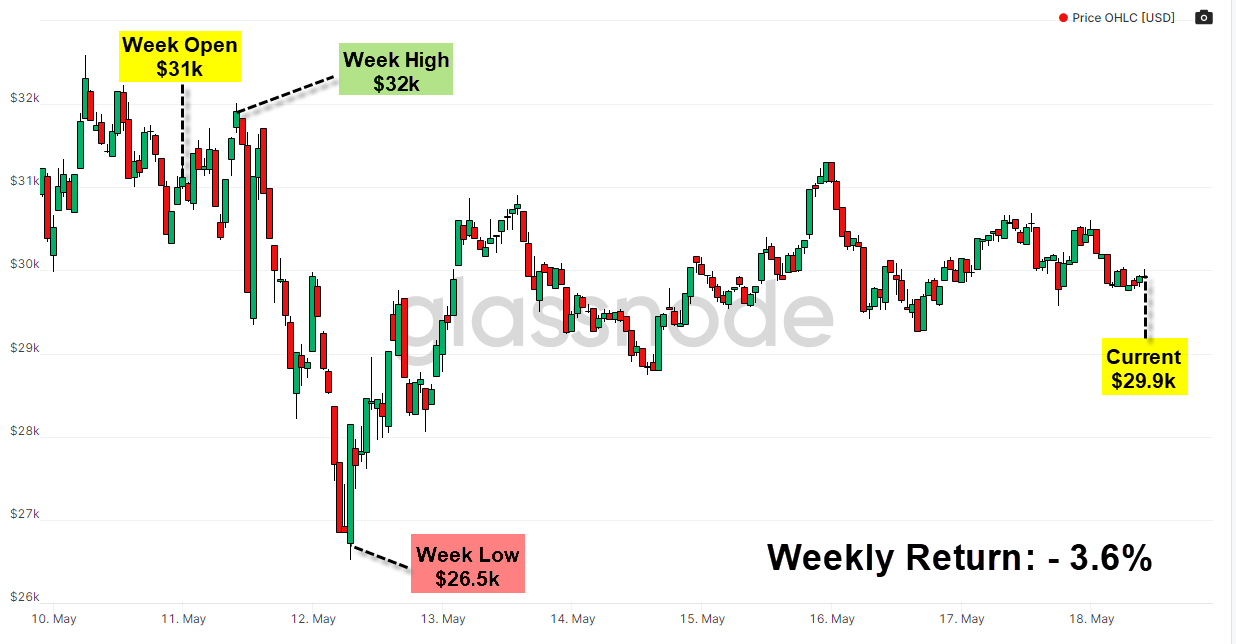
- BTC experienced a volatile week and dropped to lows last seen in 2020.
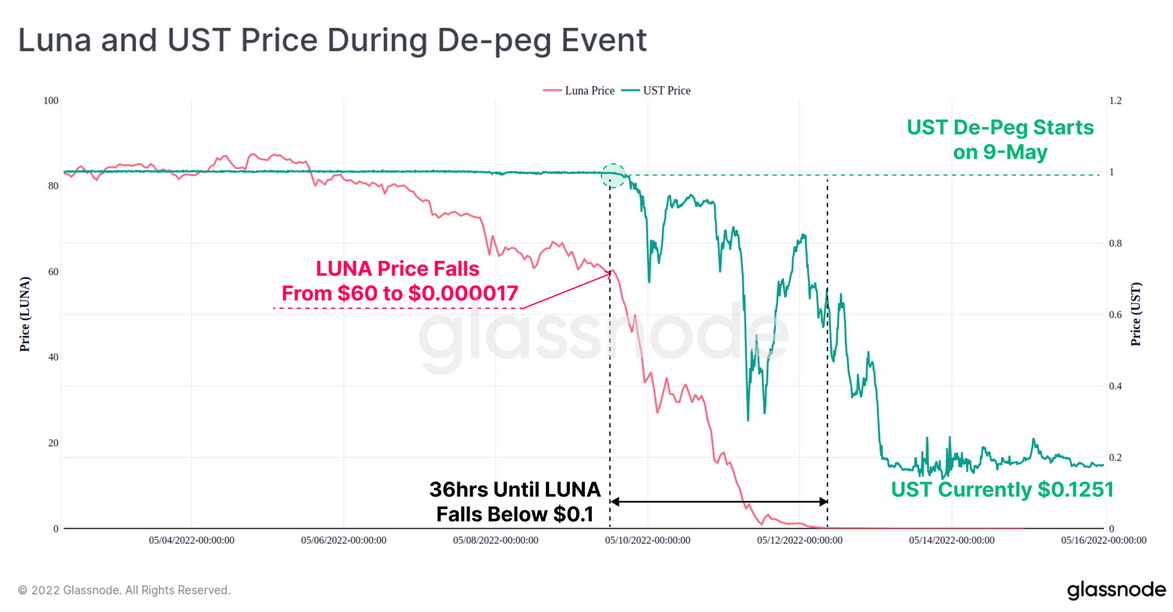
- UST stablecoin lost its dollar peg & LUNA crashed by 99%.
- Luna Foundation Guard emptied 80k BTC reserves.
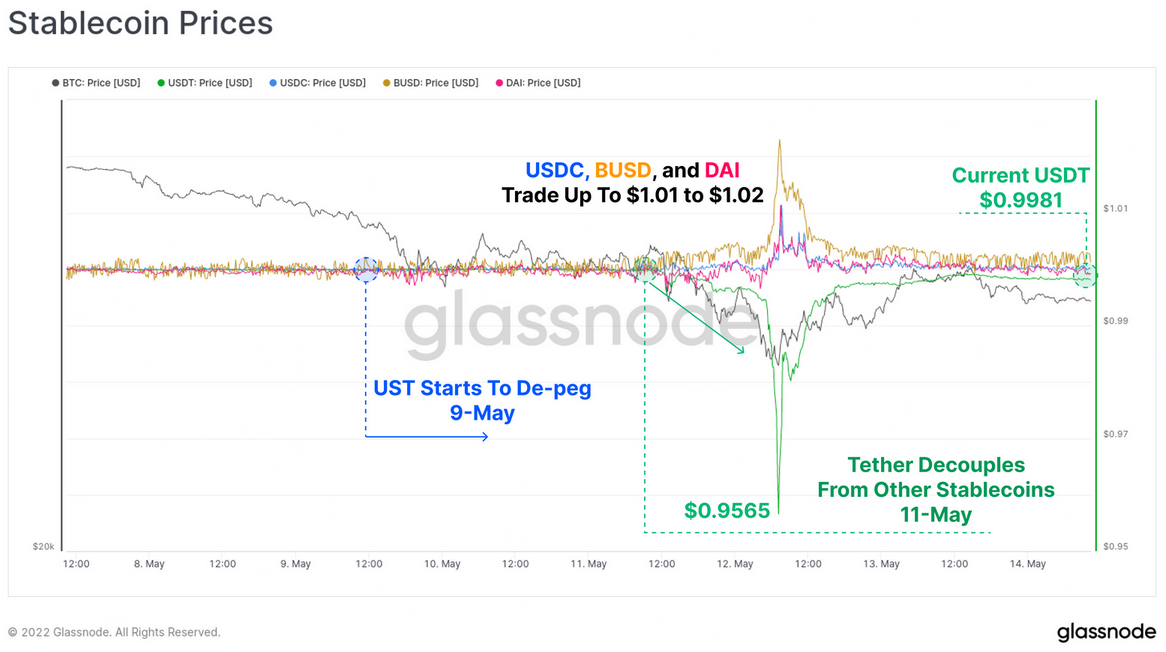
- Tether temporarily lost its dollar peg as investors increasingly rotate into USDC.
- BTC experienced historic levels of realized losses.
- Price hovers above proven bottom level established by realized price.
- BTC-Equity correlations reached new all-time high.
Weekly Price Action
UST-LUNA devaluation
On the 8th of May, stablecoins captured more than $135 bn in value between USDT, USDC, BUSD, DAI, and UST.
Stablecoins can generally be represented in three types:
- Collateralised (USDT, USDC, BUSD)
- Crypto-over-collateralised (DAI)
- Algorithmic (UST)
In the case of UST and LUNA, the algorithmic design allowed for users to convert 1 UST into $1 worth of LUNA (and vice-versa), irrespective of the market price of both assets.
This means that the LUNA supply contracts (and price often rises) when there is demand for UST. However, when demand falls, and prices move to the downside, the supply of LUNA can (and did) hyper-inflate.
UST de-peg
- The UST peg began to break on the 9-May, where LUNA was trading around $60 (~49.5% off the $119 ATH)
- Over the next 36-hours, LUNA prices fell below $0.1, and the UST peg traded between extremes of $0.30 and $0.82
- Users both panicked, and arbitraged the Luna exchange of 1 UST for $1 worth of LUNA, inflating the supply and depressing prices further
Sale of $80k BTC by LFG
- As the UST peg traded lower, the Luna Foundation Guard (LFG), (non-profit in charge of maintaining the UST peg), began to deploy their recently acquired Bitcoin reserves in an effort to stabilise the peg
- Their total reserves had built up to 80,394 BTC worth $3.275 Billion and were completely emptied over a 21.5 hour between the 9th and 10th of May
- Aggregate exchange balances increased by around 88k BTC over this period, which is higher than the 80,394 sold by the LFG
- This signals that these events triggered a contagion effect and panic, as Bitcoin investors added sell-side pressure
USDT de-peg
- On 11-May, the largest stablecoin by market cap ($83 bn), Tether (USDT) saw its peg come under pressure
- Over the period from midday 11-May to midday 12-May, USDT traded below its $1 peg to a low of $0.9565, before recovering within 36hrs to trade at a slight discount of $0.998
- During this time, other major stablecoins USDC, BUSD and DAI experienced a 1% to 2% premium as investors moved towards assets they perceived were less at risk of contagion
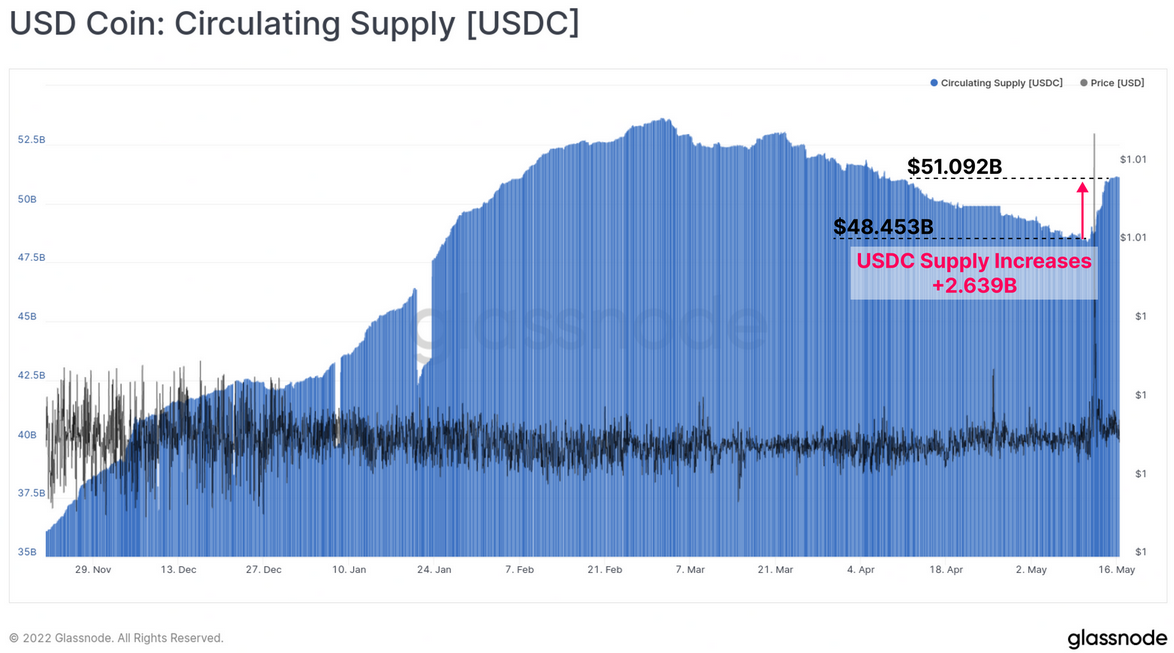
Rotation into USDC
- USDC reversed the trend of supply contraction that has been in place since late Feb, expanding by $2.639B
- Given the dominant growth of USDC over the last 2yrs, this may be an indicator of changing market preference away from USDT and towards USDC
-
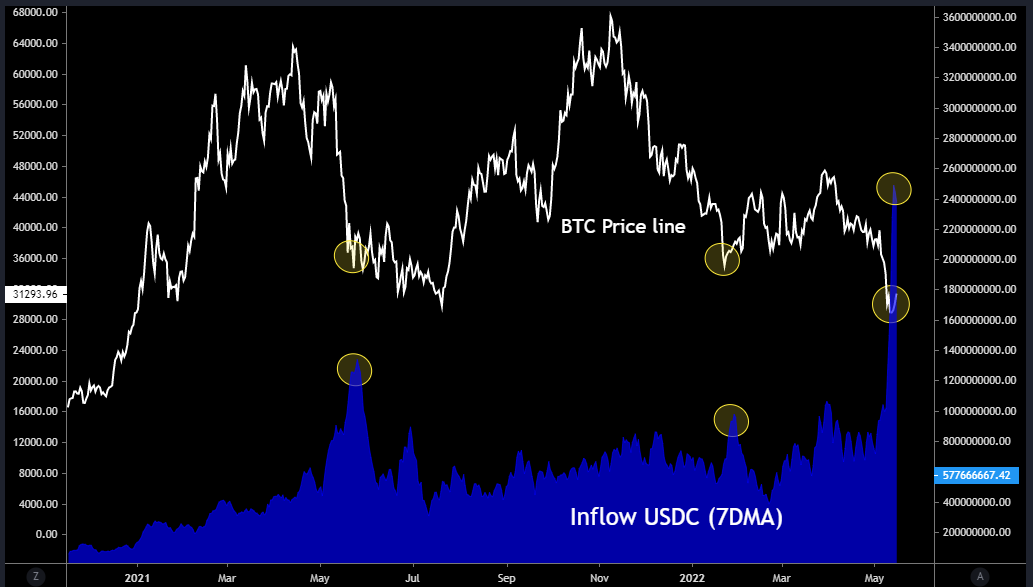
At current low BTC price levels, many market participants are willing to buy, as can be seen with the inflow of $USDC stablecoin on exchanges on the graph below
-
Bottoms in BTC price have coincided on three occasions with spikes in USDC exchange inflow since 2021
-
The largest spike during this period occurred recently, which indicates a potential rotation from $USDT to $USDC
Historic Realized Losses
-
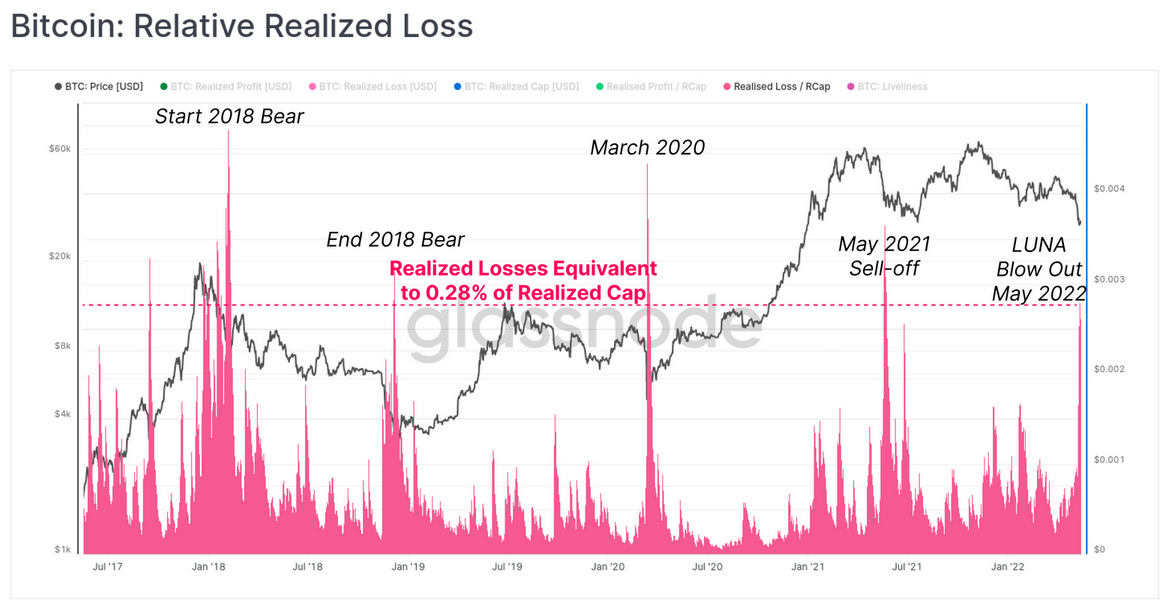
Net losses realized by all on-chain spending hit over $2.5Billion for two consecutive days, which is on par with the largest capitulation events in history
-
LFG alone contributed a realized loss of $703.7M
-
The 'relative realized loss' metric is established by dividing daily realized loss across the network by the Realized Cap to compare apples between cycles, as the total value of BTC, and therefore the value of losses has grown over time
-
The LUNA capitulation precipitated one of the largest loss events in the last 5 years
This is comparable to:
- The start and end sell-off events of the 2018 bear market
- The March 2020 COVID crash
- The May 2021 sell-off, which interestingly is celebrating its 1yr anniversary this week
Realized Price
- The Realized Price is one of the oldest, and most fundamental metric concepts in on-chain analysis.
- It is calculated by dividing the Realized Cap, which is the sum of all coin values at the time when they were last moved, by the circulating supply
- It reflects an estimate of the average price paid for all coins in the supply
- Historically, the Realized Price has provided sound support during bear markets, and has provided signals of market bottom formation when the market price trades below it
-
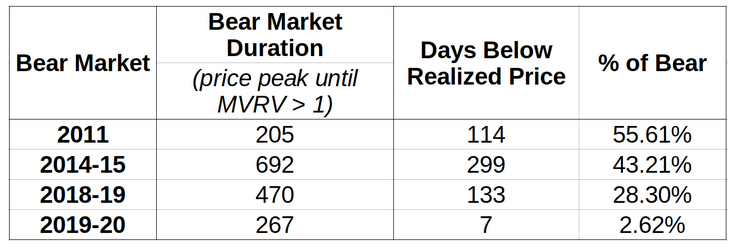
The table above shows the previous bear market cycles, and the proportion of time when prices traded below the realized price
-
It can be seen that over time, each bear cycle has spent less relative duration below the realized price
-
March 2020 remains the most notable deviation, with just 7-days spent below the realized price
-
As the market hit the weekly price low of $26,513, the Realized Price was trading at $24k, and spot prices fell within 9.5% of the Realized Price
Macro impact on Crypto Markets
- We are entering a similar regime as in 1968-1975, where an increasing US 10-year maturity, due to high inflation pressured the S&P 500 downward
- We can notice how the S&P 500 deviated from the US 10-year maturity yield's direction
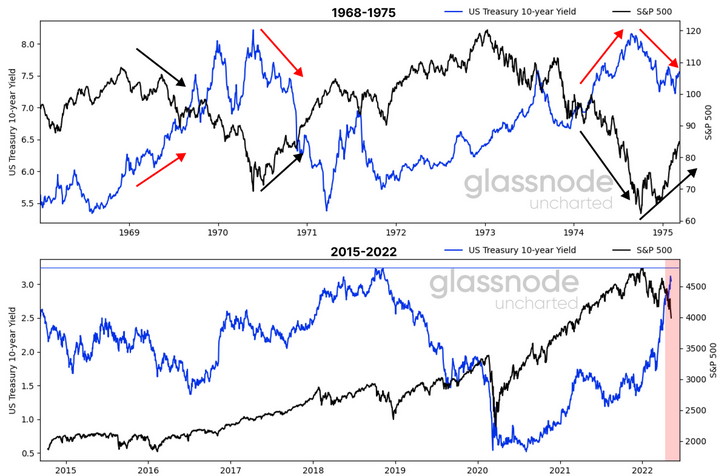
- From a macro perspective, as the bond selloff turns systematic, the correlation between bitcoin and the S&P 500 has soared to unprecedented levels

Conclusion
- The shockwaves of a de-pegging event, especially in the largest stablecoin USDT will and has had widespread impacts as stablecoins become increasingly integrated within the market
- The double momentum from UST and USDT depegging, approximately $40B in LUNA/UST value destroyed, and the LFG selling 80k worth of BTC created the perfect storm
- It remains to be seen if a full return to the Realized Price is required for BTC price to reverse, and if so whether it is for months, weeks, days
- There remains a plethora of macro, inflationary and monetary policy forces acting as hurdles ahead
Sources
- Glassnode
- Glassnode Uncharted
- Cryptoquant


