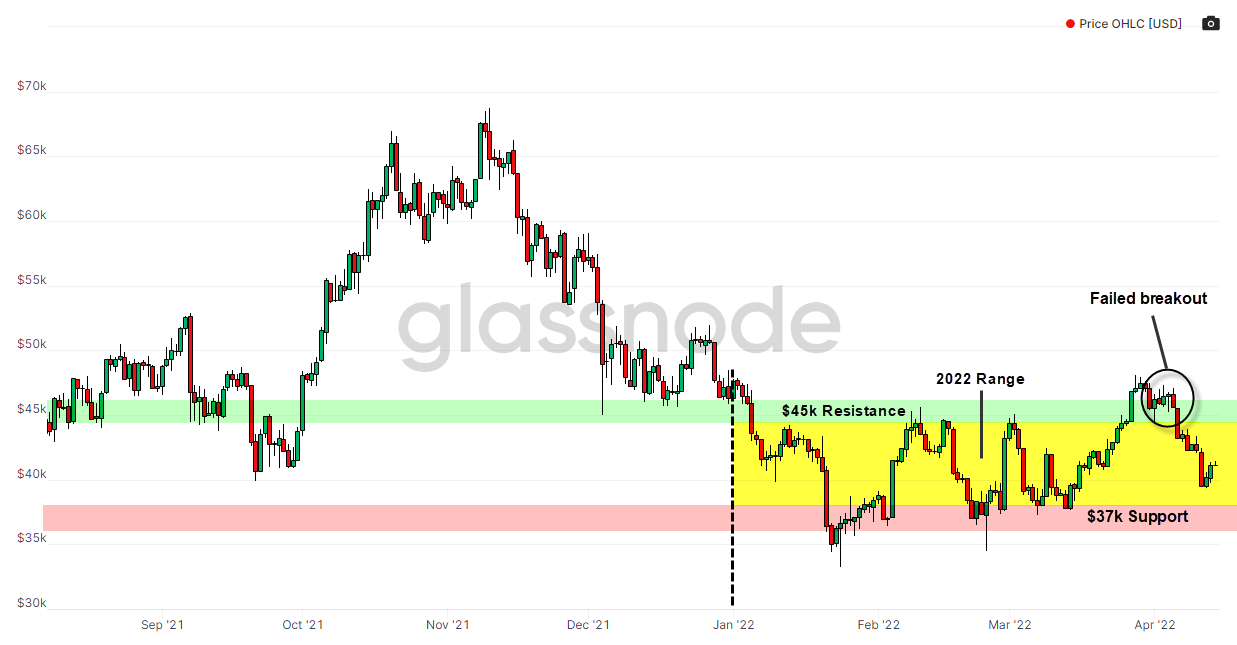
- BTC falls back within its 2022 range after failing to breakout above $45k
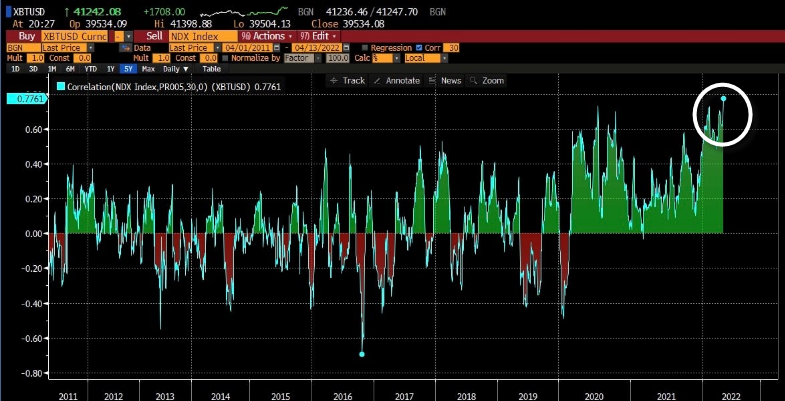
- High US inflation numbers pushes the BTC-NASDAQ 30-day correlation to an all-time high
- Sell pressure linked to profit-taking failed to be absorbed by the BTC market
- Large investors accumulated BTC at this week's price lows
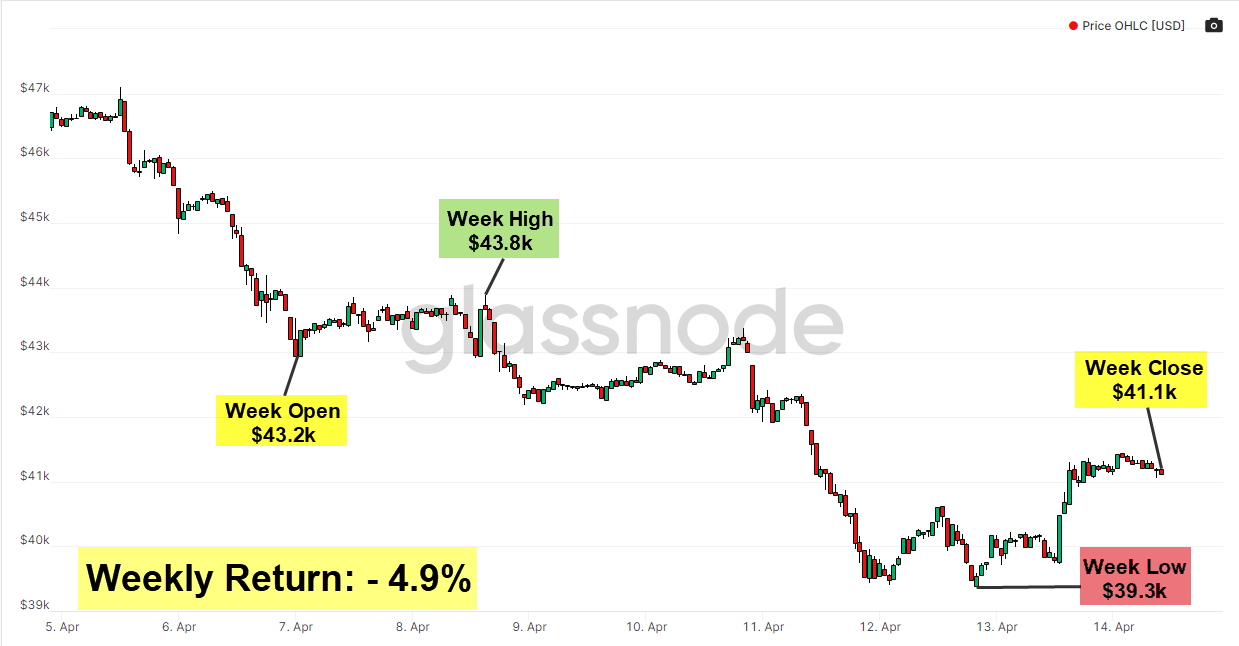
Weekly Price Action
Price: $41.1k
Week Open: $43.2k
Week High: $43.8k
Week Low: $39.3k
7-day return: - 4.9%
US Inflation
- The US labor department announced this week that US inflation increased more than expected as the month-over-month and year-over-year increases came in at 1.2% & 8.5% respectively
- The market is now pricing in a 50 bps rate hike in May & June
- News of higher than expected inflation or hawkish statements from central bank officials continue to push risk-on assets lower such as BTC & growth stocks
30-day correlation between BTC-NASDAQ
- The 30-day correlation between BTC & the NASDAQ has reached an all-time high of 0.77
- The crypto market is currently in a waiting position in view of the unique and rapidly evolving macro-environment
Price Structure
- BTC continues to trade within the $37k-$45k range its been in so far in 2022
- Price failed to sustain its break above $45k last week and declined back within the 2022 range
- Price could rapidly decline to $30k if the $37k support level is broken
- Similarly, price could accelerate to $52k if the $45k resistance level is broken
Mild profit-taking in the market
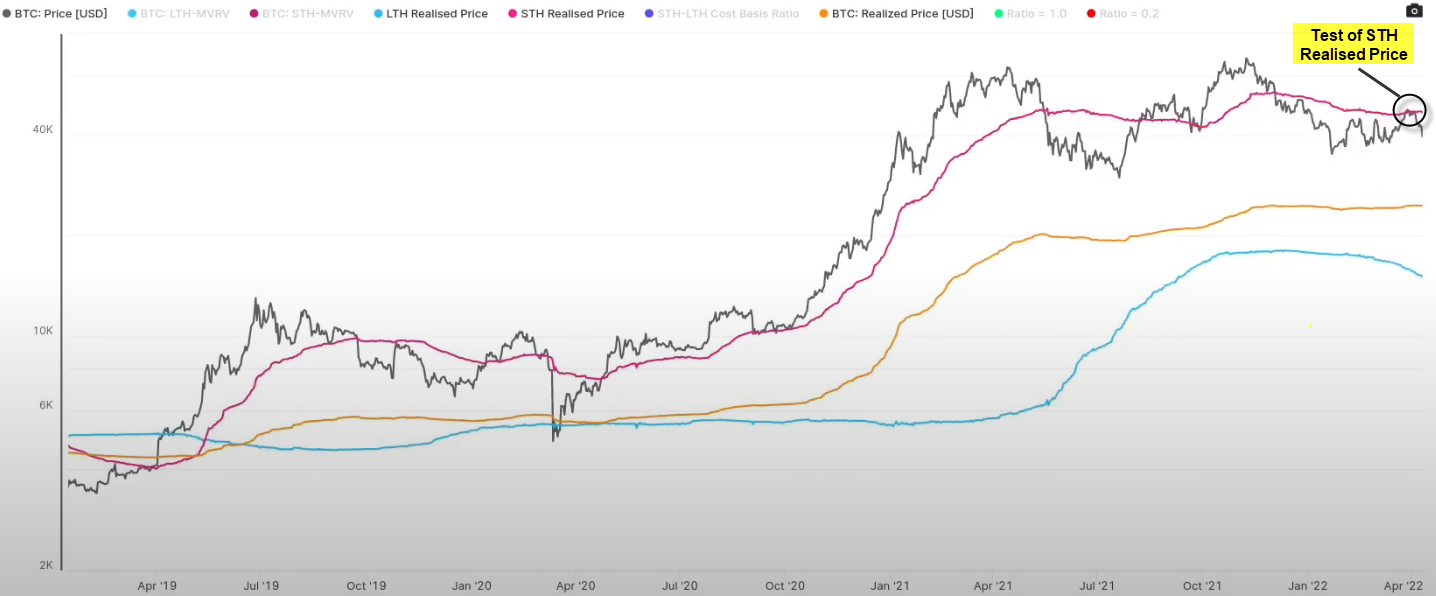
Short-term Holder Cost-Basis
- An investor that has held their Bitcoin for less than 155-days is considered a short-term holder (STH)
- Realised price is the price at which a Bitcoin was last bought
- STH Realised price is the average price at which all STHs have bought their Bitcoin, and is a reliable gauge of long-term price directionality
- Price tested the $47k realised price level last week before dropping and resuming its sideway movement as investors realised gains
- A sustained break above the STH realised price could signal the start of a sustained uptrend in price
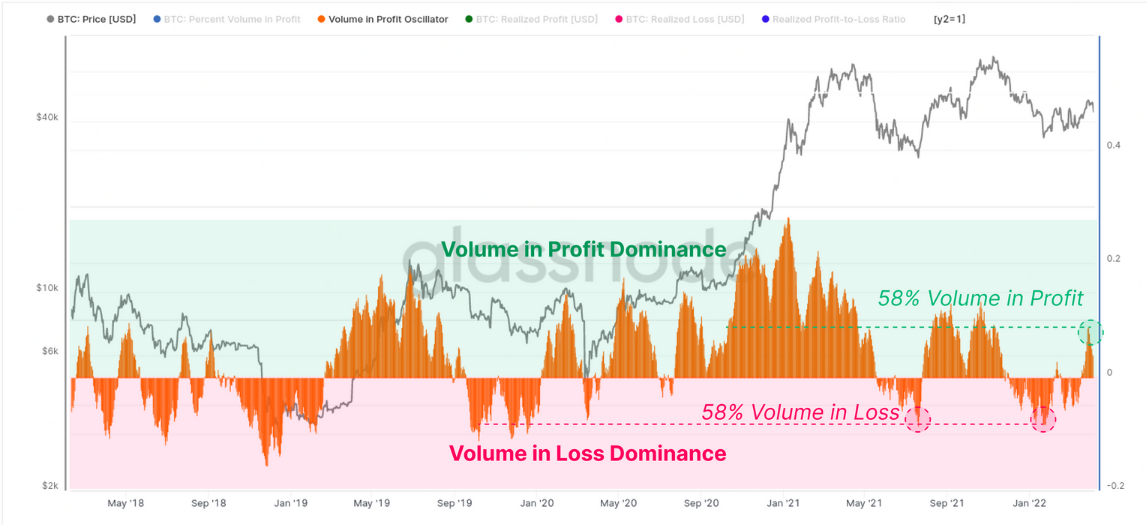
Volume-in-Profit ratio
- This metric describes the percentage of all BTC transfer volume that was in profit or loss
- Average volume returned to profit last week after a regime of losses in 2022
- Investors realized profits last week when prices increased to a yearly high of $47k
- Up to 58% of all transferred volume was profitable last week
- This sell pressure was not absorbed by the market as prices subsequently declined
- Historically, sustained periods of volume in profit have lead to bull runs
Whales have bought the dip
Total Supply Balance for addresses holding between 1k-10k BTC
- The yellow line illustrates the total balance of BTC held by addresses holding between 1k & 10k BTC
- The black line represents BTC price
- In the last month, whale balance has served as a proxy for near-term price action as increases in whale balance have coincided with increases in price and vice versa for declines in whale balance
- According to this pattern, we can expect strength in price in the near-term given the spike in whale balance last week


