Weekly Price Action
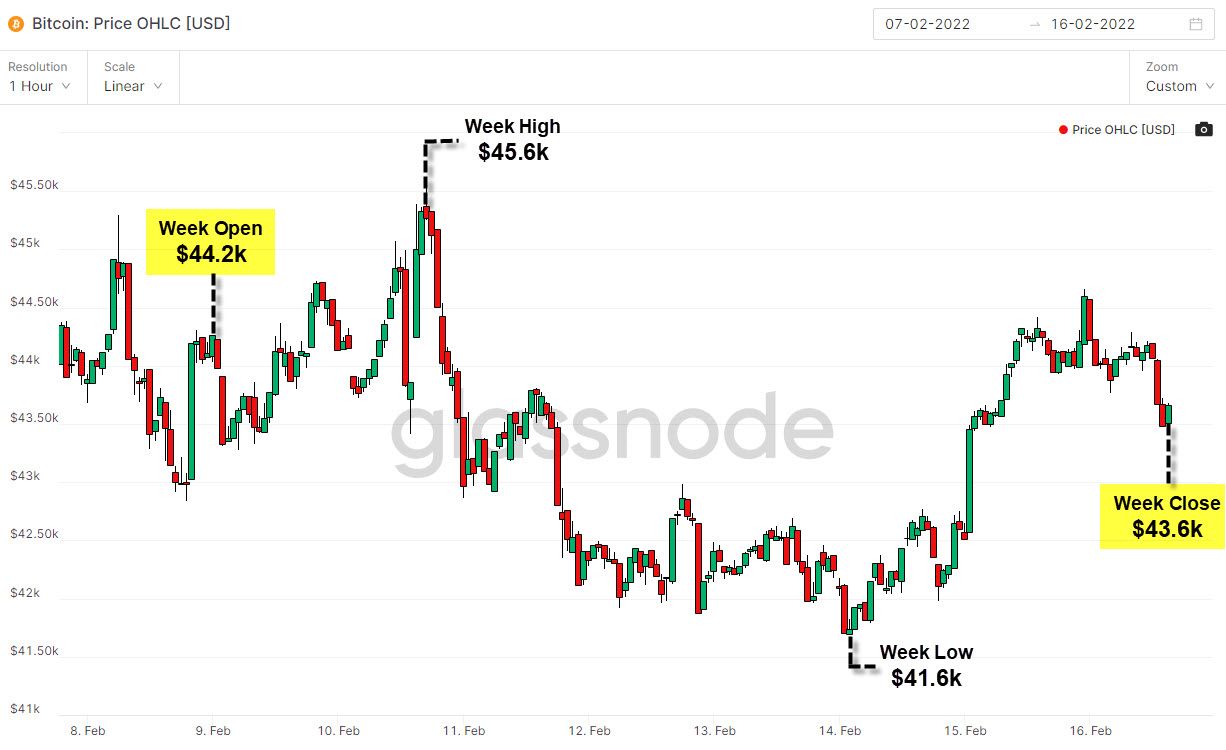
- BTC price has remained almost unchanged, opening at $44.2k and closing at $43.6k which consitutes a weekly decline of just over 1%
- It has continued to trade within a tight range since breaking above $40k
- This range is currently between $41.6k and $45.6k, the weekly low and high respectively
Bitcoin Price Structure
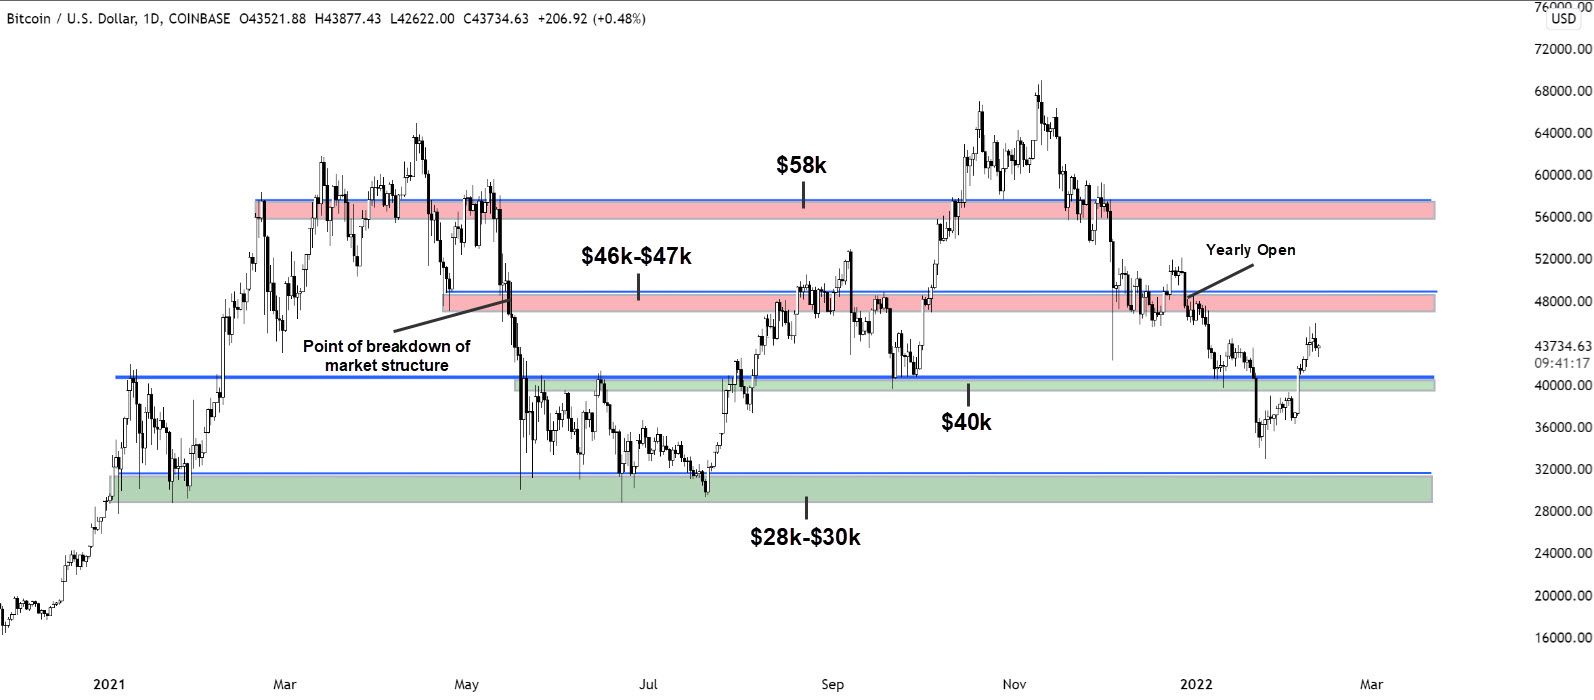
- BTC has traded within a vast range in the last year between $30k-$60k
- There are several key areas within this range:
- $28k-$30k
- $40k
- $46k-$47k
- $58k
- A retest of $40k would be healthy as a higher low would be set
- If price breaks below $40k, then we could expect a retest of the $28k-$30k local low
- $47k remains a strong area of confluence as it is the:
- Point of breakdown of market structure during May crash
- Point of 2022 yearly open
- Short-Term Holder (STH) Realized Price level
- Observed on-chain
- Average price of all coins bought by STHs (coin holders for < 155 days)
- We can expect resistance at this level, however price can also establish a constructive higher low if price breaks above this level
Macro uncertainty pushes investors to de-risk through derivatives
- A significant amount of leverage has been removed in the Bitcoin market in the last week
- Investors are increasingly favoring put options since the new year
- This risk-off behaviour is due to widespread uncertainty in the market, caused by macro factors such as:
- Interest rate hikes in March by the Federal Reserve
- Ukraine - Russia tensions
Futures Open Interest Leverage Ratio
-
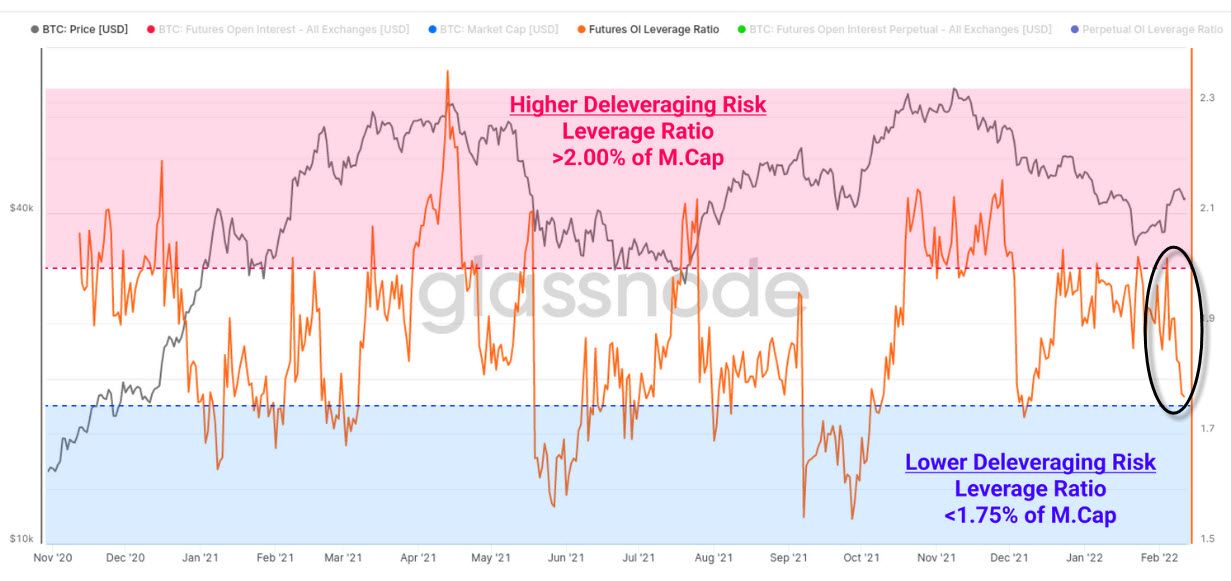
The graph below describes the amount of leverage used in the BTC futures market (orange line)
-
We can observe significant deleveraging across the futures market last week (circled in black)
-
The metric has reached a relatively low level of leverage as it has declined from 2.0% to 1.76% of market capitalization, which is a level that was last reached on December 4th
-
This suggests that traders are opting to close out their futures positions and limit their leverage given the uncertainty in the market currently
-
This method of de-risking is a contrast to what we have observed in the BTC market recently, as sharp declines in leverage and futures' exposure in the past were mostly due to forced liquidaitons such as the December 4th long squeeze
Options Open Interest Put / Call ratio - Deribit
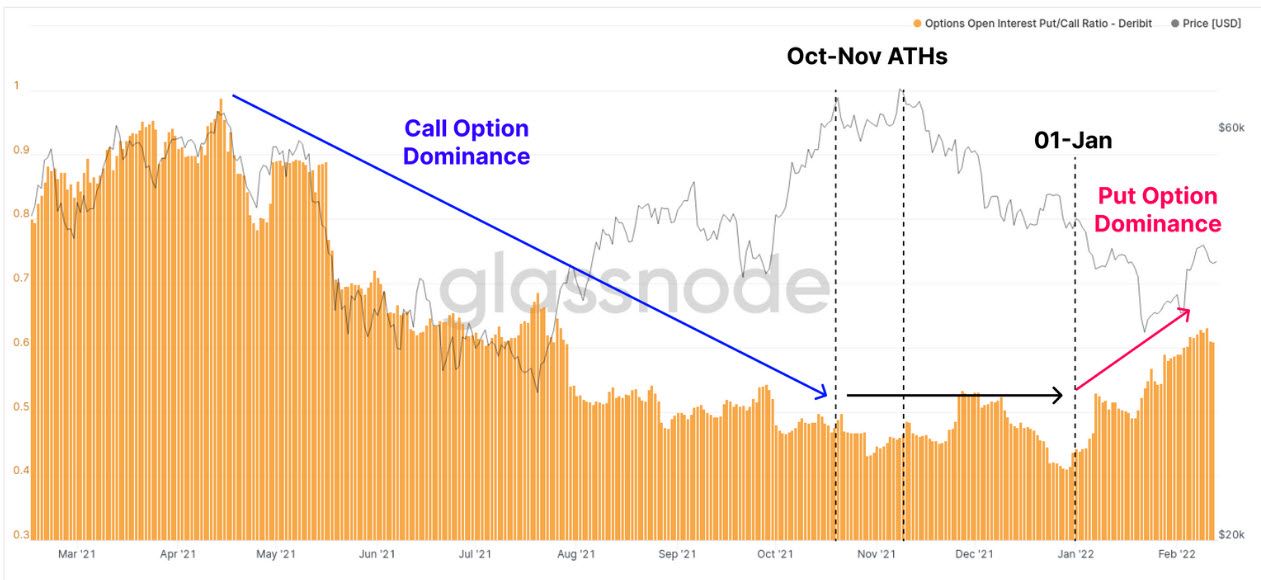
- We can infer short-term investor sentiment by viewing the ratio between call and put option open interest on Deribit (derivatives exchange)
- Downtrend: Calls > Puts
- Uptrend: Calls < Puts
- The put / call ratio continues to climb since the new year as traders are preferring to buy protective puts in response to uncertainty in the market
- The transition from traders favoring speculative call options to protective put options is quite clear following the Oct / Nov all-time highs (ATHs) and is indicative of a new regime of more bearish sentiment from derivatives traders
Options Open Interest by Strike Price - Deribit - March 4th
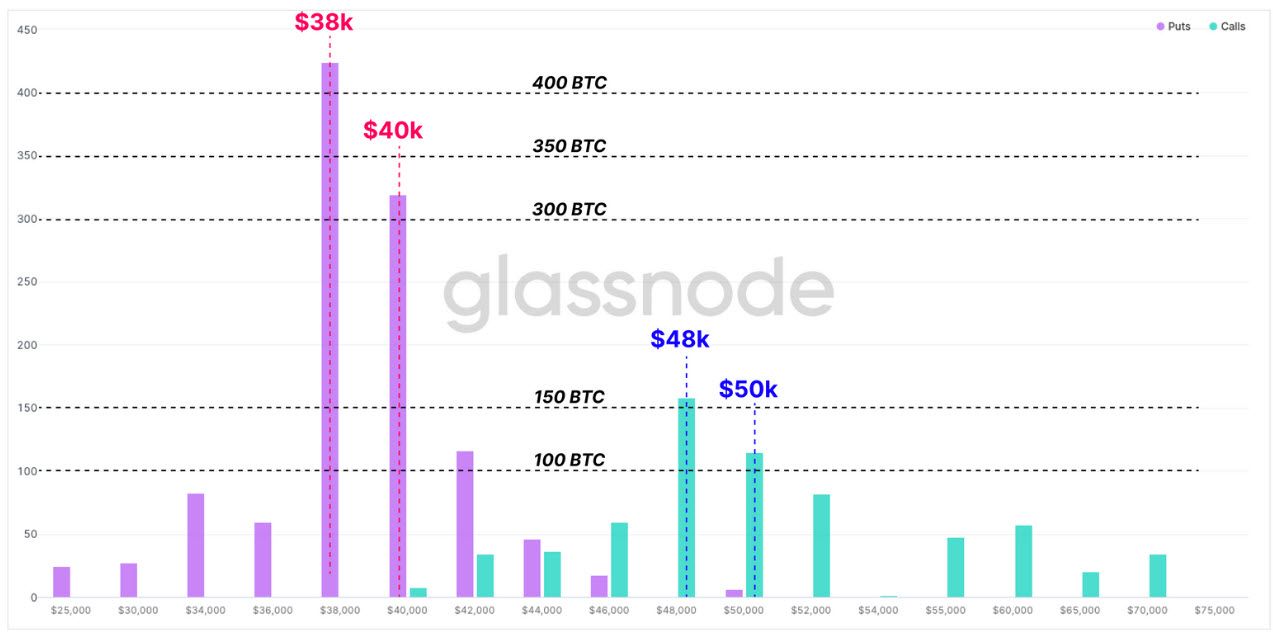
- We can infer short-term investor sentiment by viewing the distribution of volume of put or call options across all strike prices for contracts expiring on March 4th
- There is a clear concentration of puts (purple) with a strike between $38k-$40k, confirming that traders are pricing in a decline in price from current levels
- Therefore investors have a preference for protective puts and conservative leverage as a means to de-risk in light of macro uncertainty
Bitcoin Market is Maturing
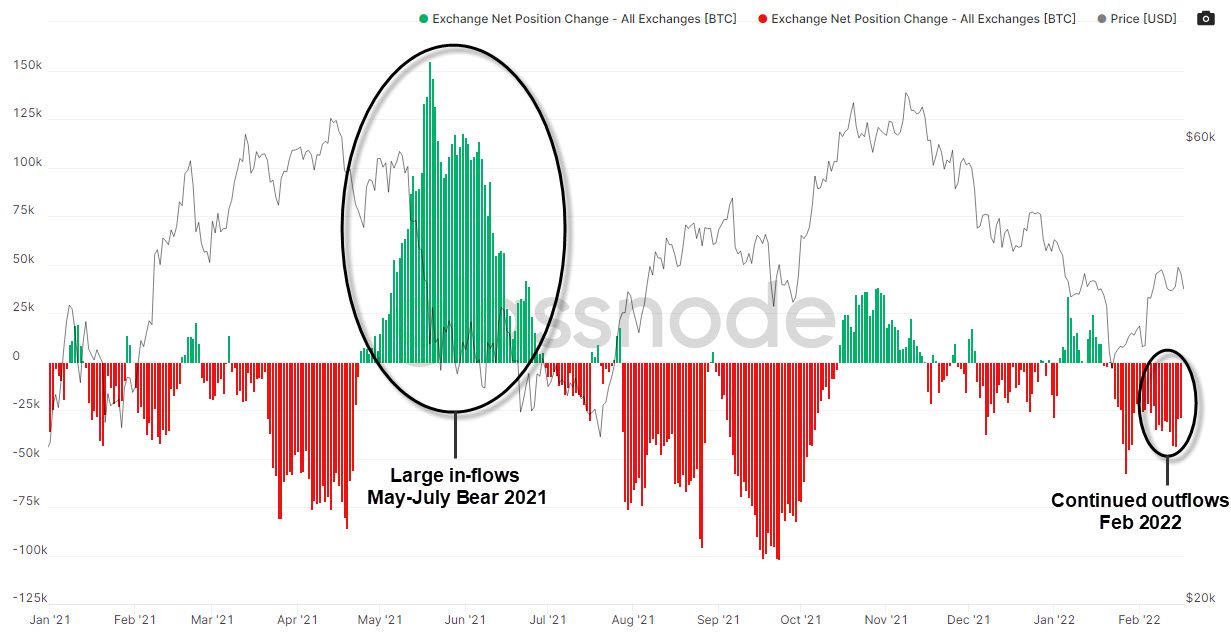
- In previous Bitcoin market cycles, investors would de-risk their positions by selling their positions on spot markets
- This would cause large net inflows onto exchanges as can be observed during the May-July bear market in 2021
Exchange Net Position Change
- There is currently a strong trend of net outflows, especially in the last three weeks, despite the risk-off attitude in the market currently
- This confirms that investors are opting to derisk via derivative instruments, rather than selling on the spot market
- This is a sign of the maturation of the Bitcoin market
Bitcoin / Equity Correlation
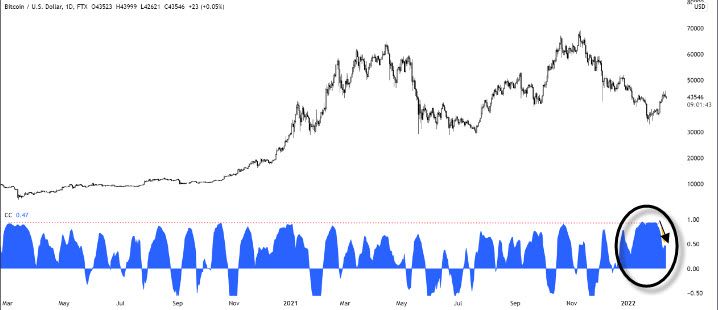
- Bitcoin's correlation to the Nasdaq has fallen over the last week, after a period of high correlation which reached as high as 0.96
- The decoupling of this correlation is largely due to BTC spiking by 11% on February 4th whilst the equity markets continued to move sideways
- It is to be seen whether this decoupling will remain, especially after the rate hikes in March
Stablecoin Supply - All Exchanges
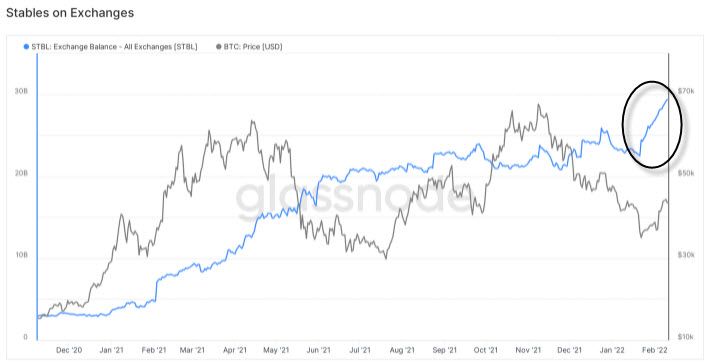
- In the last few weeks we have observed a large influx of stablecoins onto exchanges
- Such an influx can occur if a lot of investors need to collaterize derivative positions however current open interest levels are low making this unlikely
- It is therefore likely that investors are loading their accounts with capital to purchase Bitcoins, which is bullish moving forward
Conclusion
- Bitcoin has continued to trade in a small range between $41.6k-$45.6k
- $40k & $47k remain a key support & resistance levels respectively
- BTC traders are uncertain about short-term price action and have de-risked their positions
- Leverage used in futures markets has returned to low levels
- Investors are increasingly opting for protective puts with a concentration of puts around the $38k-$40k area level for the March 4th contracts
- BTC / Equity correlation has continued to decrease in the last week
- Stablecoin supply has spiked in the last two weeks, signalling the potential of a buying impulse


