- Fundamental Support found between $36k-41k level
- Mayer Multiple Model suggests macro bottom is set
- Upward momentum in price is increasing pushing traders in profitability
Weekly Price Action
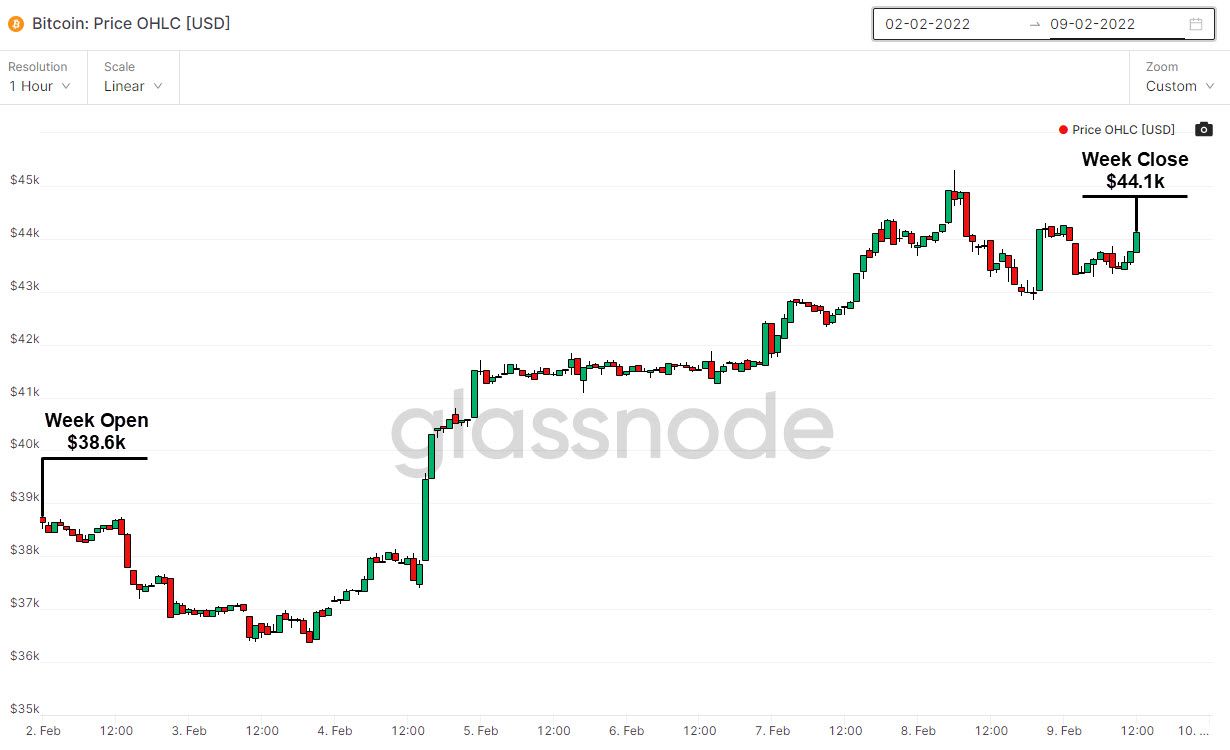
- Since last week, price has increased by 12.5% from $38.k to $44.1k at the time of writing
- Price jumped by 10% in the space of a few hours on February 4th
- Bitcoin traded in a tight channel between $41k-$42k throughout the weekend
- Reached a monthly high of $45.2k before settling at $44.1k
Fundamental Support
UTXO Realized Price Distribution
-
Realised price is the last price at which Bitcoin was transacted
-
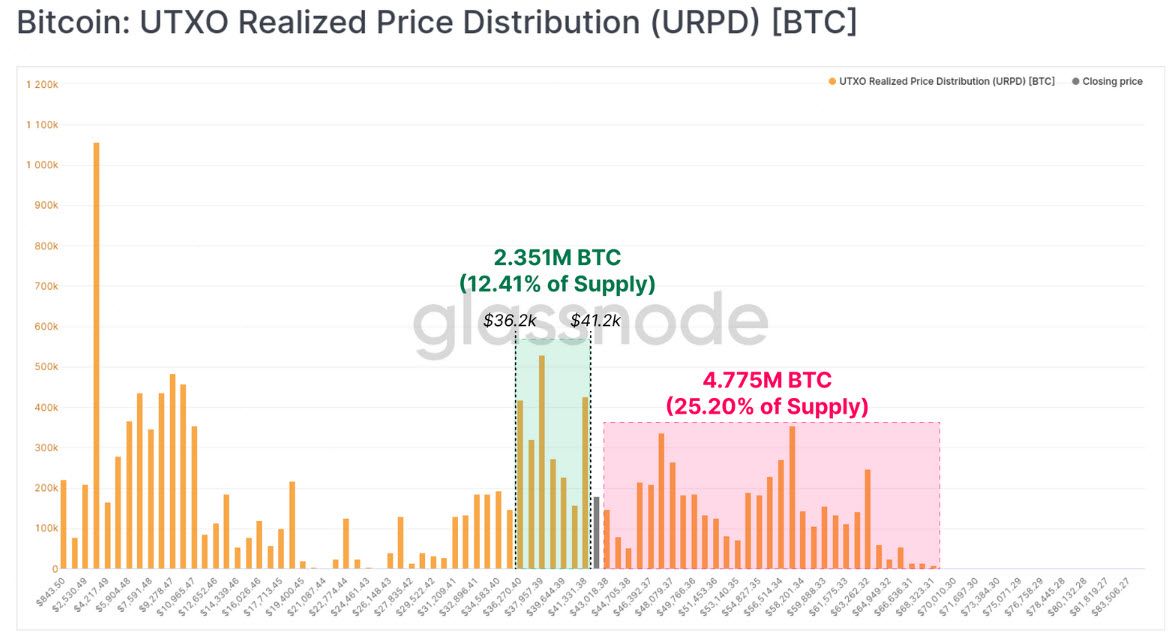
URPD Metric shows the distribution of realised prices for the current supply of Bitcoin
-
12.41% of supply has last transacted between $36.2k - $41.2k
- This zone has consolidated as a strong support zone as a lot of coins were bought within this range since last week
-
On another note, 25.20% of the current supply was last transacted above current price levels, meaning that the market is top heavy
- A top heavy market infers that investors that a significant portion of the market bought above current price levels
-
The Bitcoin market is top heavy despite the three month downtrend since November 2021
-
As such, if current uptrend in price continues, it will likely meet several resistance points above
Macro Bottom ?
Mayer Multiple Model
-
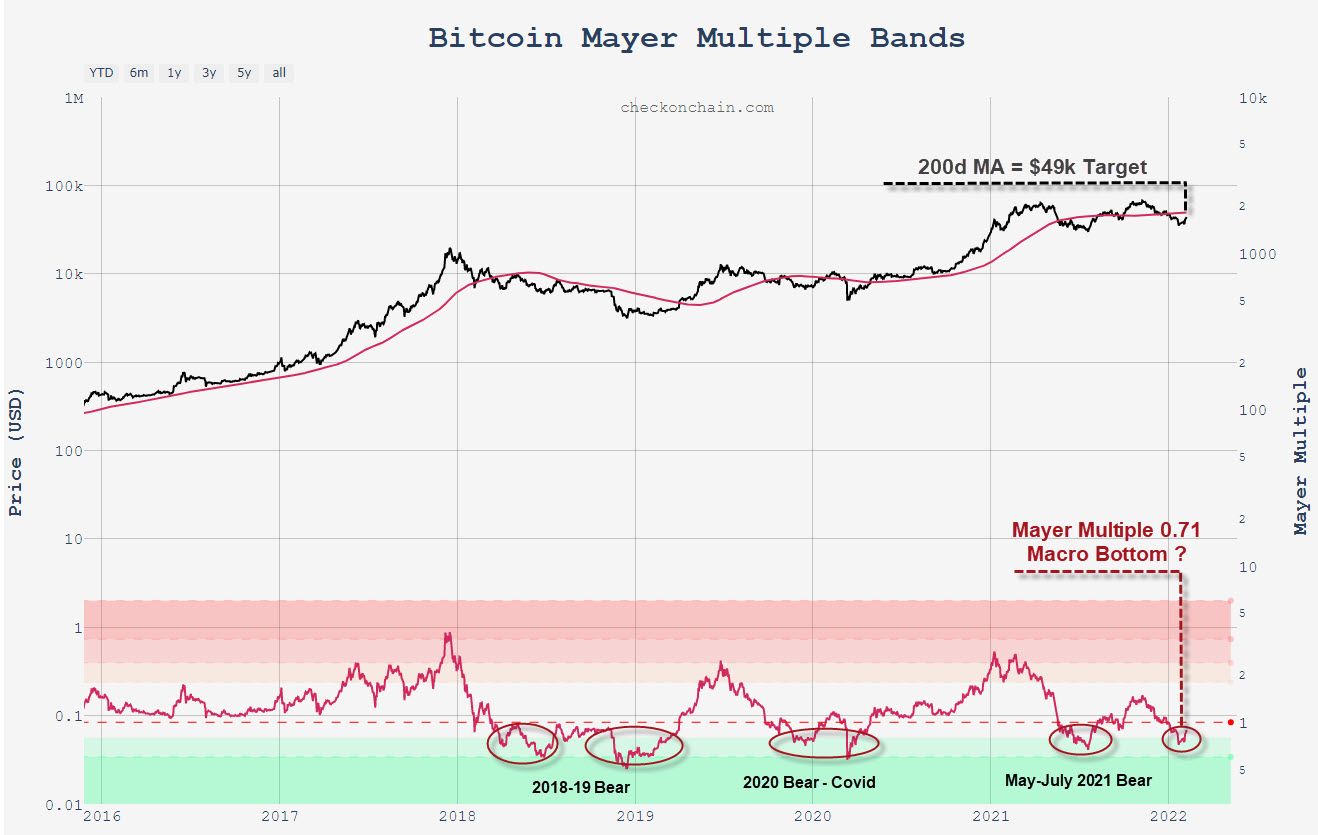
A simple but effective method to gauge whether prices have bottomed, is to use the Mayer Multiple (MM) Model
- It is calculated as a ratio between price and the 200-day moving average (MA)
- The 200d MA is widely observed as a macro indicator in 'Technical Analysis' & can therefore indicate degrees of under / over valuation relative to the long-term mean
-
The MM reached -0.71 at the end of last month, which represents an almost 30% discount relative to the 200d MA
-
Bitcoin has historically been undervalued at current MM levels which have in the past three years signalled generational bottoms
-
To confirm that a bottom has been set and that the uptrend in price has resumed, we would need to see MM break above 1.0 (Current Price = 200d MA) and retest 1.0 successfully (MM breaks above 1.0 -> retraces back to 1.0 -> bounces off 1.0 and resumes uptrend)
-
According to the Mayer Multiple Model, price needs to surpass $49k (current 200d MA) for MM to break above 1.0 and confirm an uptrend
Upward Momentum
Market-Realised Gradient (MRG) - 14d average
-
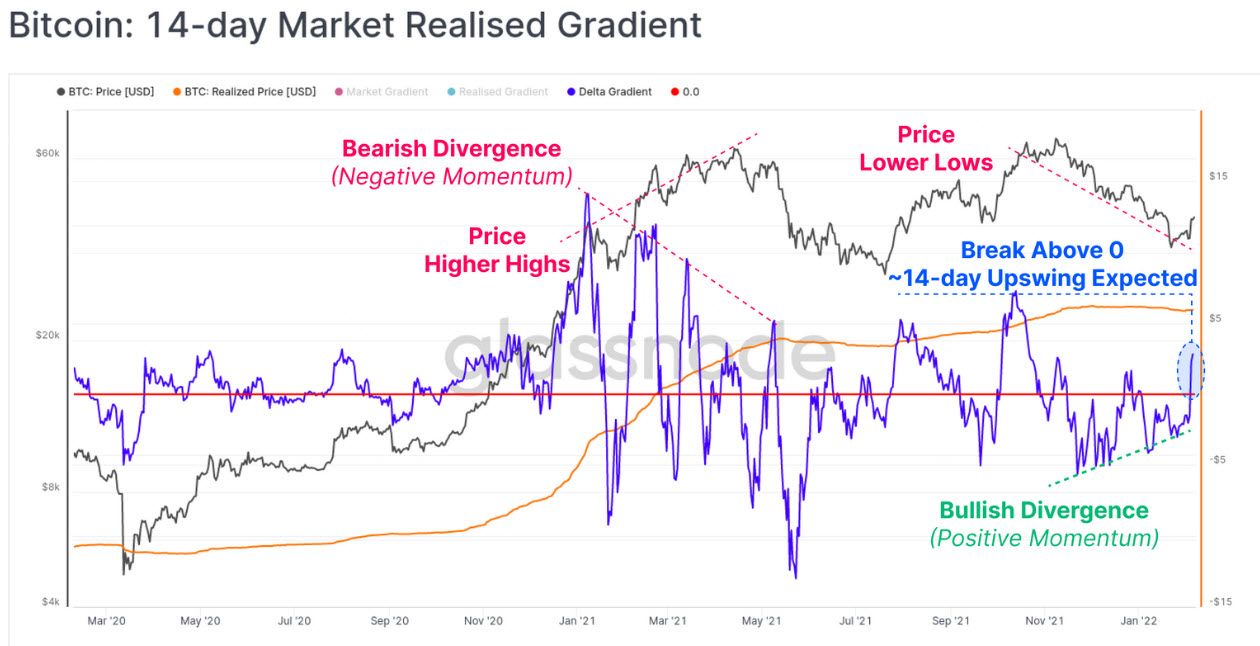
The MRG metric models the degree of momentum in price action
- Succesive higher / lower peaks indicate increasing momentum to the upside / downside
- Breaks above / below 0 indicate that a new uptrend / downtrend is in play, with an anticipated swing duration of approximately 14 days
-
Market top in Mar-Apr 2021 showed a bearish divergence as momentum was increasing to the downside as prices were increasing
-
The market currently reflects a bullish divergence, as momentum is increasing to the upside, whilst prices are declining
- As indicated in blue below, MRG has in fact broken above 0, suggesting that an uptrend over the next two weeks is in play
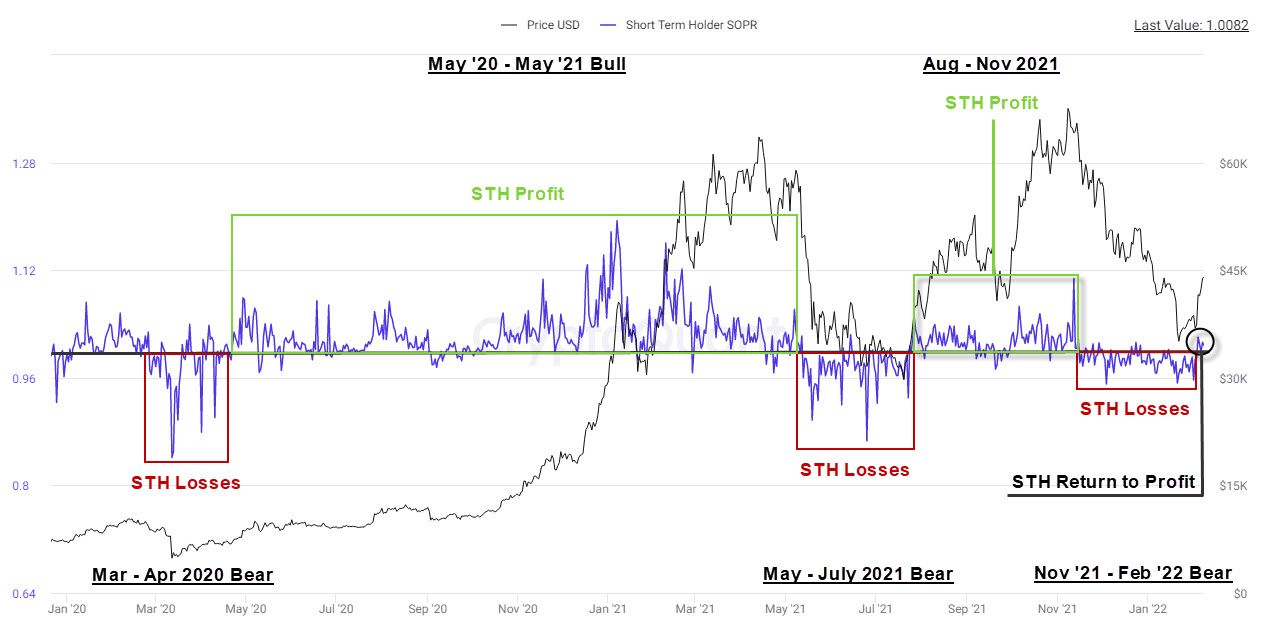
Short-Term Holder (STH) Spent Output Profit Ratio (SOPR)
-
The increasing upward momentum observed above has pushed STHs into net profit
- STHs are investors that have held Bitcoin for less than 155 days
-
SOPR reflects the realised profitability of STHs:
- Value < 1 = Net Loss; extended periods of net loss are characteristic of bear markets as indicated in red below
- Value > 1 = Net Profit; extended periods of net profit are characteristic of bull markets as indicated in green below
-
STHs have returned to net profitability with the current uptrend
Conclusion
- There is support provided in the $36k-$41k area as seen with the URPD metric
- A potential bottom is set as prices recently reached historical undervaluation according to the Mayer Multiple Model
- There is a reasonable amount of momentum behind the renewed uptrend as seen with the Market-Realised Gradient, which has** pushed STHs into profitability**
Moving forward ->
It is key to watch whether long-term holders (LTHS) will take exit liquidity as uptrend continues


