Bitcoin long Term Chart
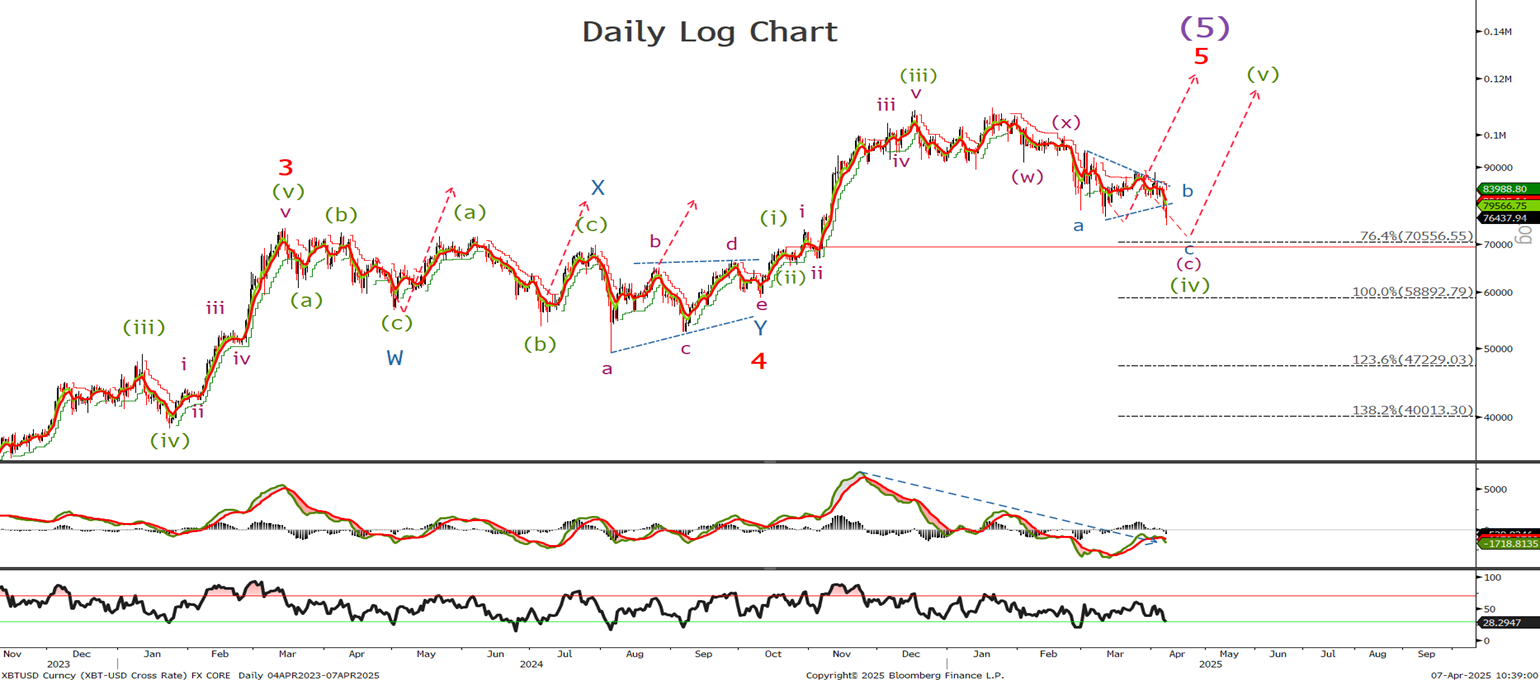
Last time we said ‘The long term bullish view remain unchanged .I have relabelled the chart as it appears we are tracing out a longer term corrective triangle. Lets look to the short term chart to see how far along the triangle we are.’ We have traded down 74424 and I have good support level around the 70555 area. A break below 69200 will not negate our bullish long term view but will call for lower BTC before the rally resumes.
Bitcoin Short Term Chart
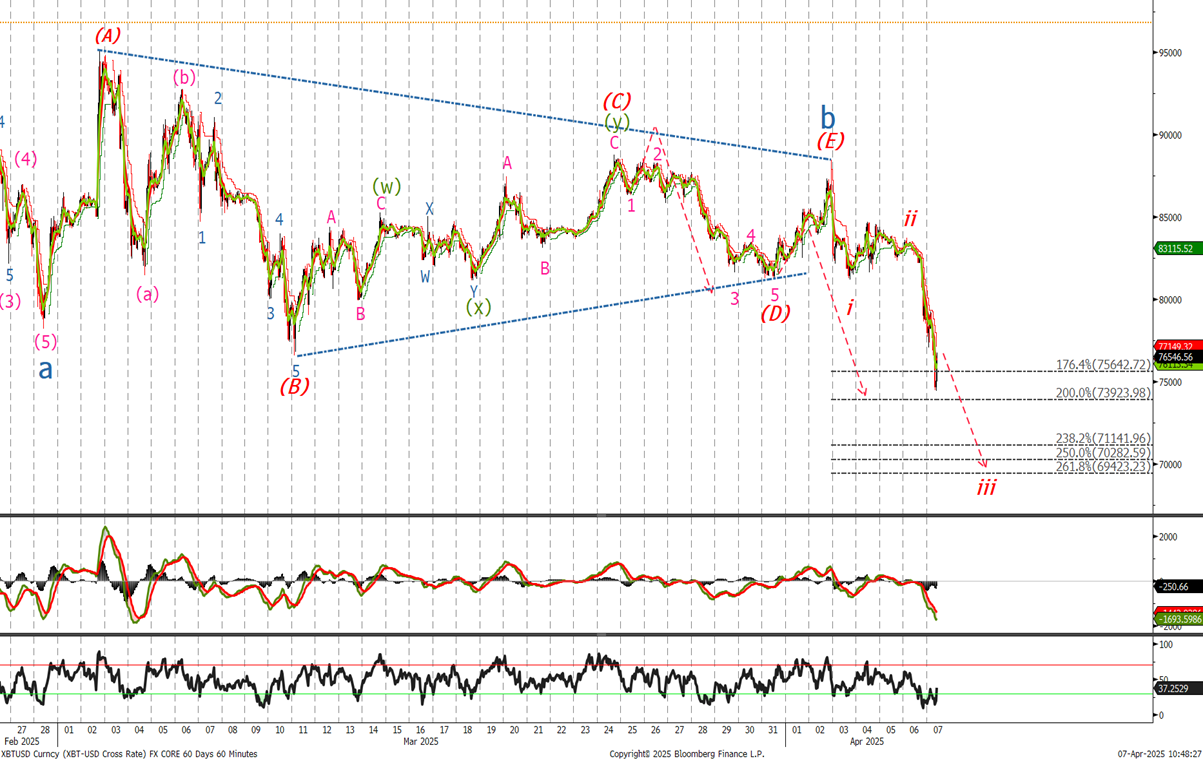
Last time we said ‘If correct then we should see a correction towards the 84200-85000 level to complete the triangle. Then a thrust lower certainly to test 75k but I would not be surprised to see spike towards the 70k level before a sharp reversal and the resumption of the longer term up trend.’
We traded up to 88555 to complete wave b triangle and have so far sold off to 74424 and it would appear to me we have a little further to go on the downside . It is possible that wave iii ended this morning on the lows. So we still expect to make at least 1 more new low and I would look to start buying in the 7200 and the 70282 and 69.5 k area. Wave v are often sharp and reverse quickly so if looking to buy make sure to place orders in the market. A move back above 84720 will signal the bullish trend has resumed.
Ethereum Long Term Chart
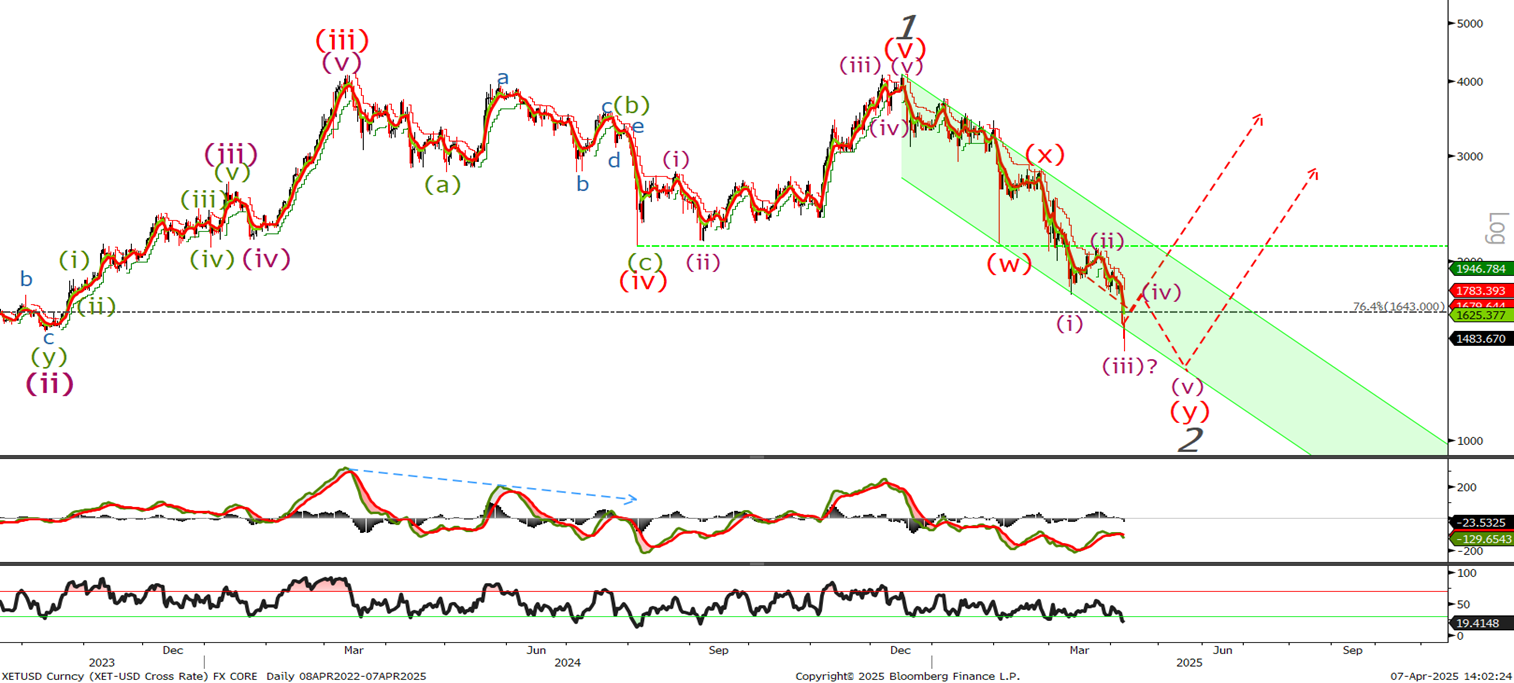
Last time we said ‘Looking at the Eth log long term chart we need to break as a minimum target the low from this month at 1756. I am not seeing any indication of a low so look to start buying ETH on a test of the 1643 76.4% retracement level.’ We are currently trading at 1624 so I am closing my long for small loss and will look to buy lower given we have yet to complete a 5 wave pattern to complete wave (y).
Ethereum Short Term Chart
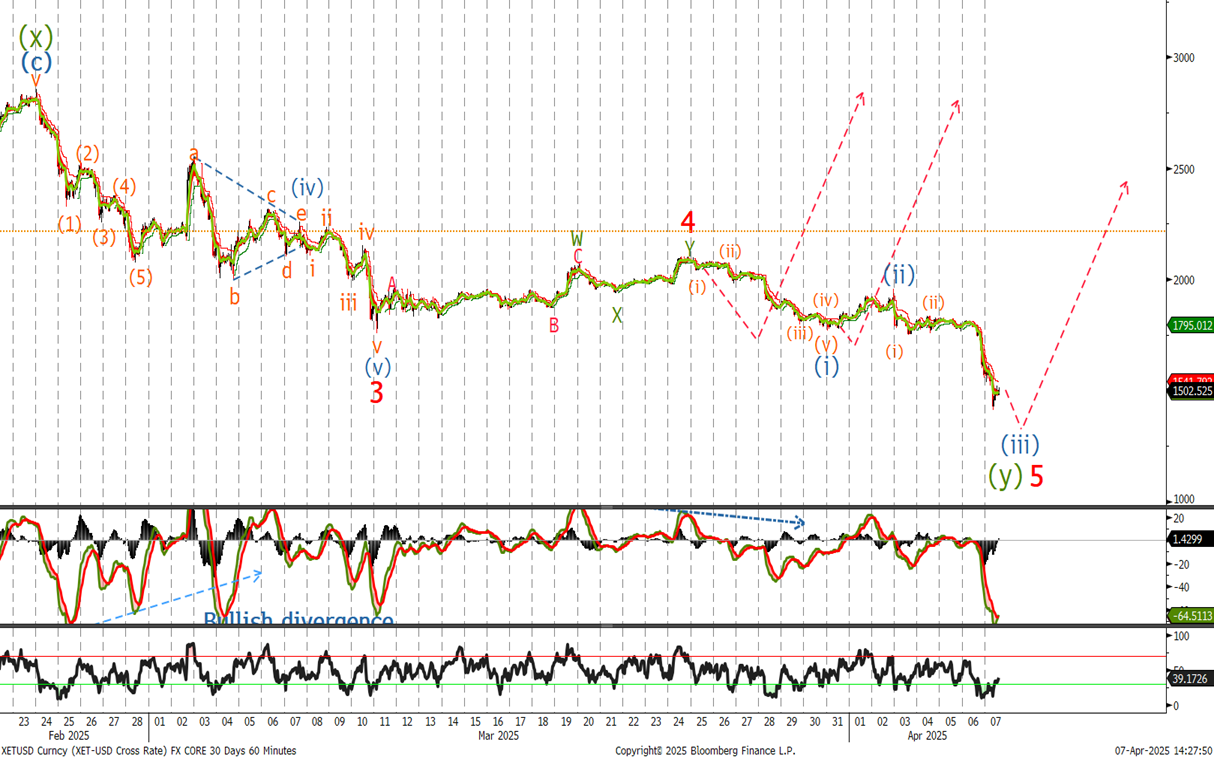
Last time we said ‘given we have reached the resistance on the topside and the bearish divergence in the MACD I am still on the look out for a final push lower. A move above 2270 will negate the bearish view and confirm the correction ended.’
As we can see the overnight was brutal and wave (iii) are usually the longest wave, however there should be 5 waves down, so we have further to go lets look to the 15 minutes to really drill down into where we are in the price cycle.
Ethereum 15 Minute Chart
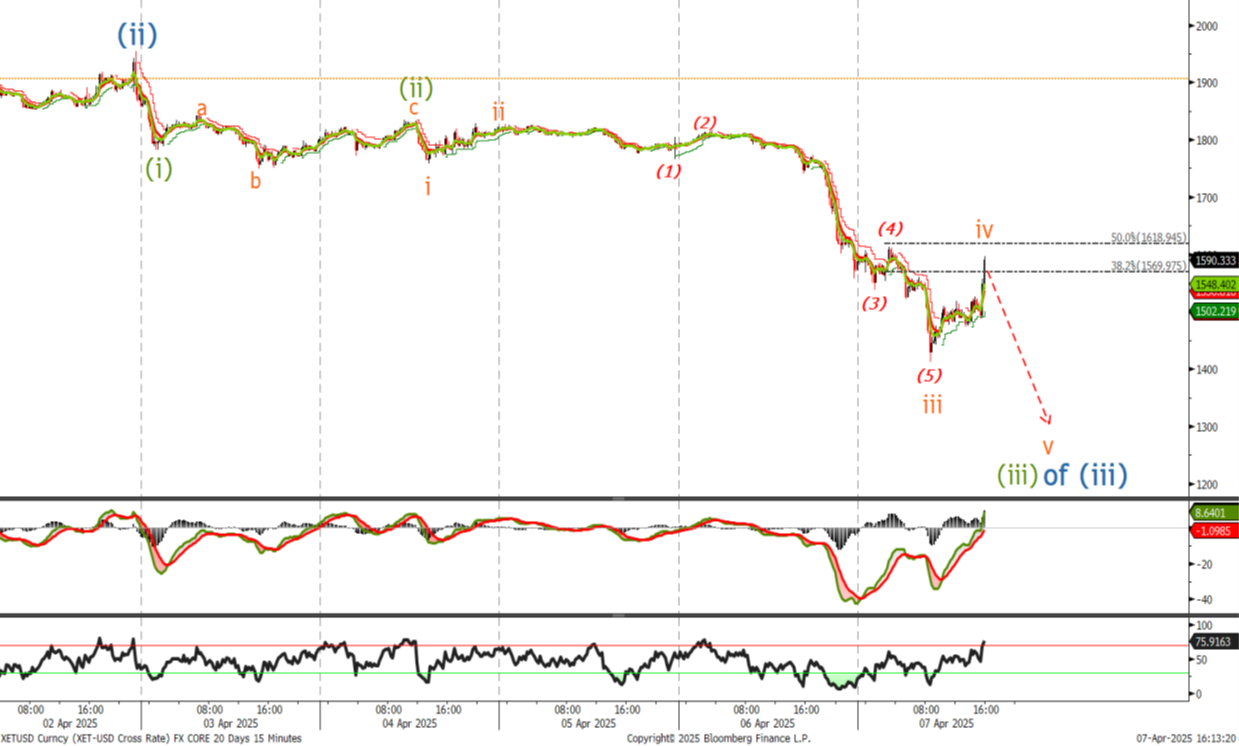
This is a very short term 15 minute chart. It is possible we have completed the short term correction and I would use the retracement to sell ETH. We should then see another new low to complete just wave (iii) of (iii) of (y). Followed by another larger correction before the final leg lower. As I said last week I am struggling a little with ETH but I remain a long term bull a break of the 870 level and I will reassess . We are testing the retracement levels now at 1594 and I am happy to sell here and look to buy lower as the count unfolds.