Bitcoin long term chart
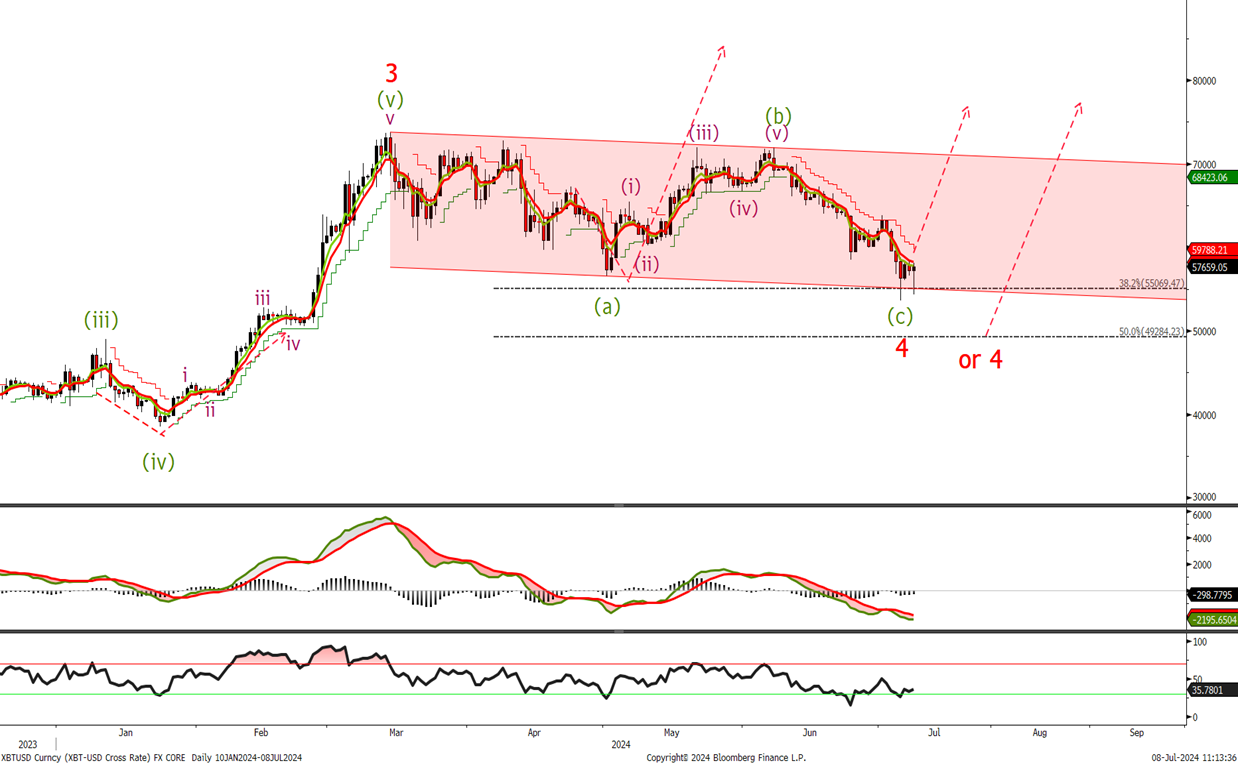
Last time we said ‘Whilst above the wave 4 low we will continue to remain long.’ We traded down to 53600 and I have relabelled the chart to take account of this unexpected move below 55K it doesn’t negate our longer term bullish view . As last time lets look at the short term to see if wave 4 has bottomed.
Bitcoin short term chart
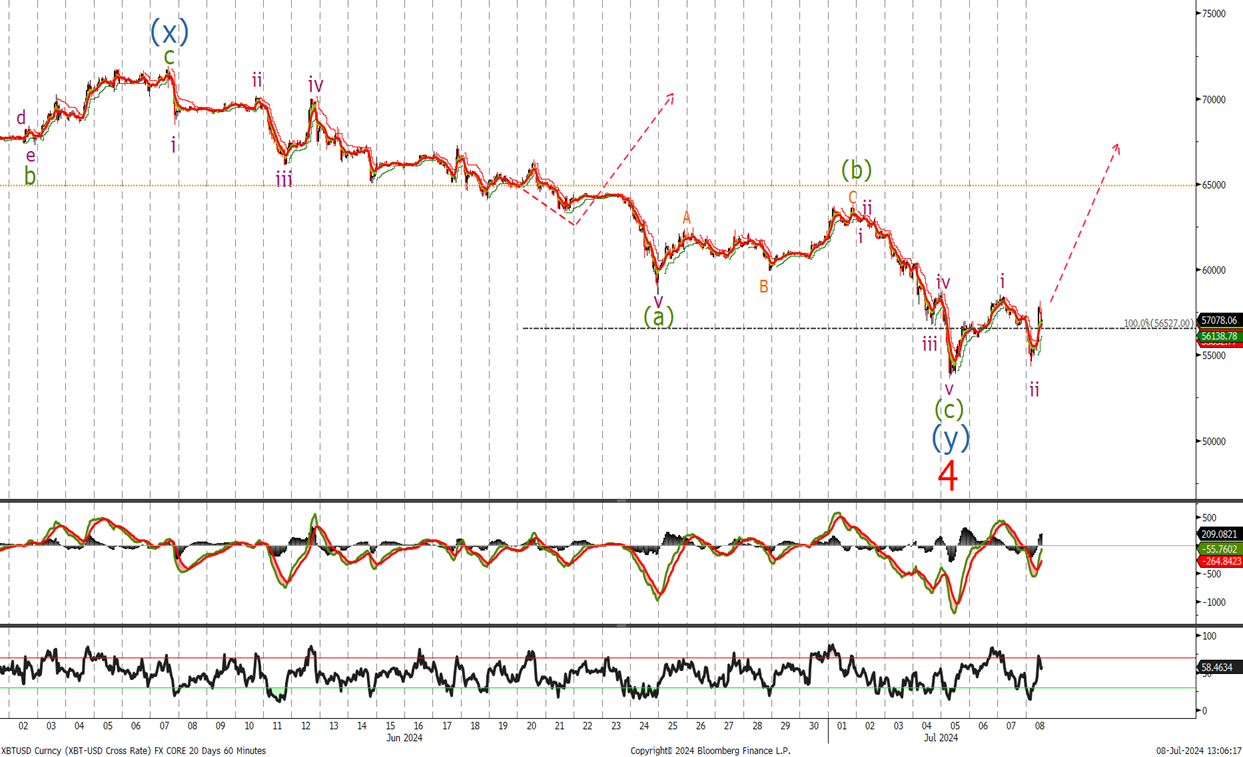
Well we got stopped on our longs at 55k but as mentioned previously longer term we remain bullish. So is this current sell off close to ending. On a purely technical basis we can count v down , the wave ii sell off this morning although sharp was soon reversed , and even though we didn’t see a new law I think from the MACD that momentum to the downside is slowing So I am rebuying the long back at current levels with stops below 53k.
Ethereum long term chart
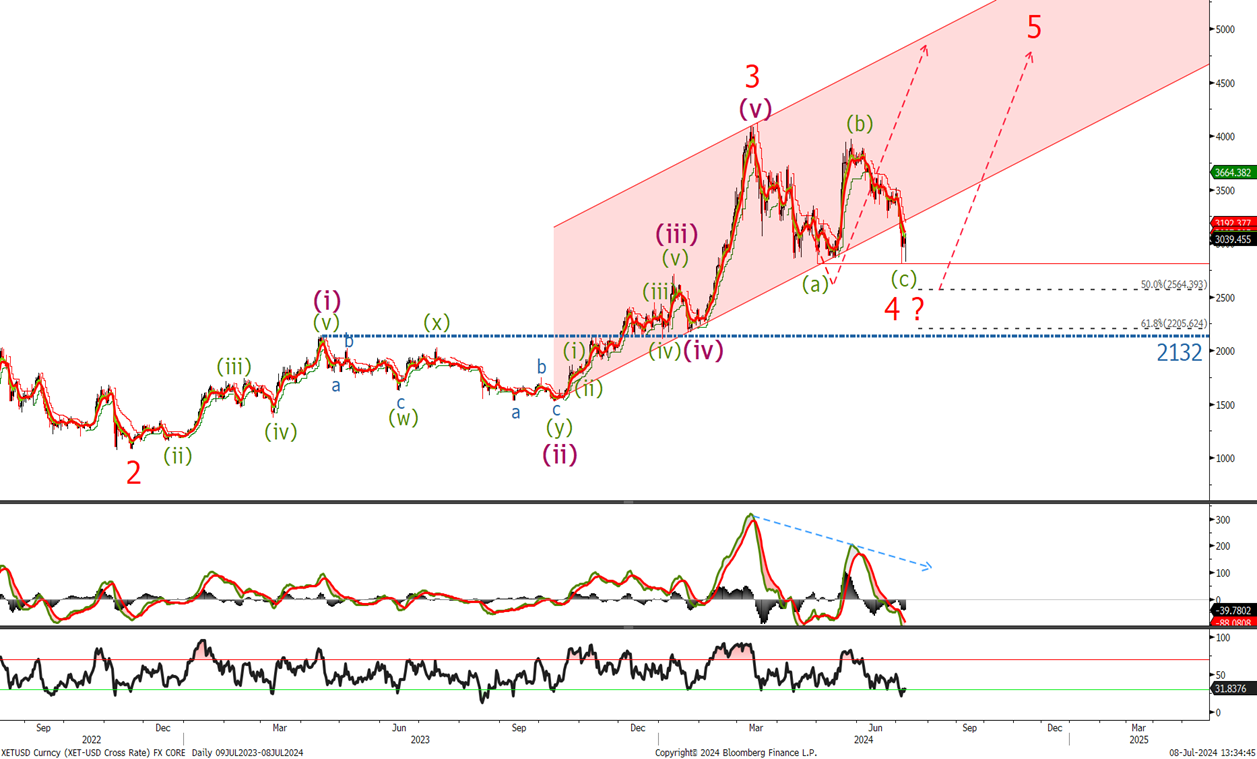
No real change from last time with XET just falling short of correction targets before rallying. We ramin bullish long term but lets look at the short term to see where we are and if a buying opportunity is soon available. I would liked to have seen ETH slightly lower like BTC making a new low , so I do not rule out one more sell off , I would buy at 2570 and add at various levels below , placing stops at 2130, a break there will nullify this current view
Ethereum short term chart
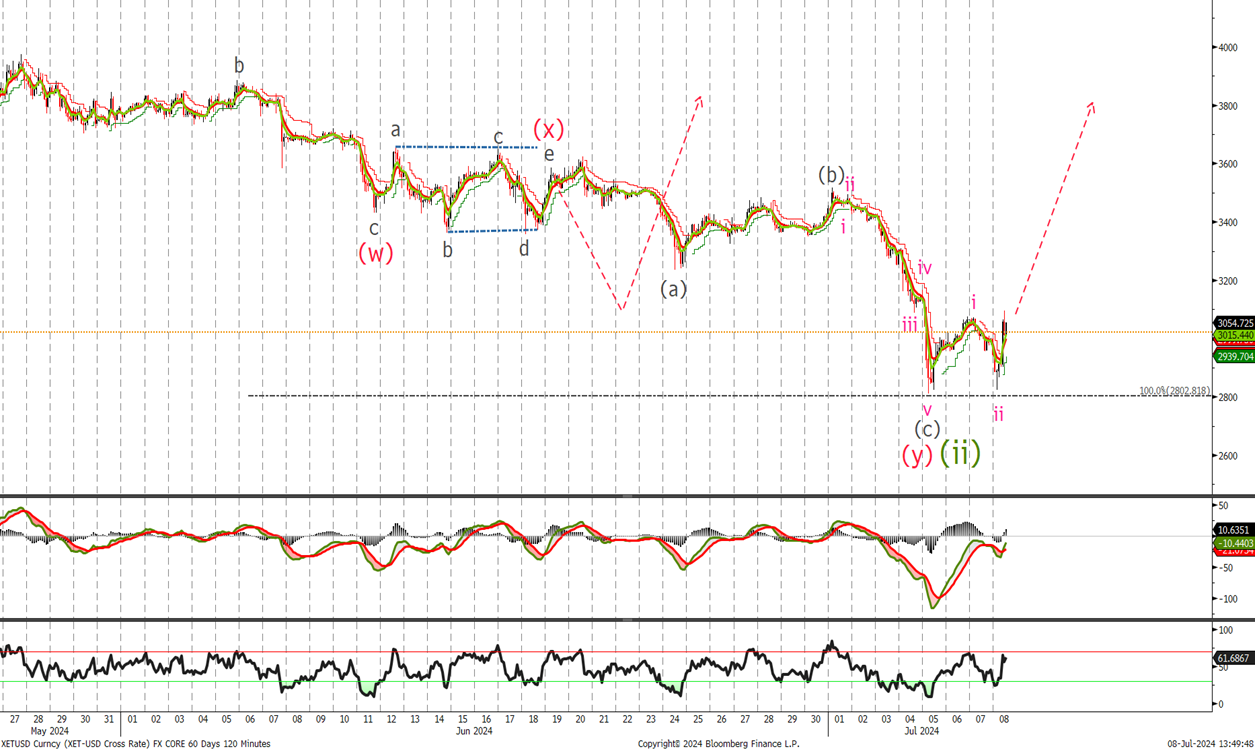
Last time we said ‘I think we have one final push lower to the 3250-3080 areas where we will buy. Lower stops to 2800 , a break there we will have to reassess the view.’ We almost got stopped with the low so far at 2802 so I will slightly lower the stop loss to 2770 and look to buy at the levels mentioned on the previous long term chart if we do sell lower. A move back above 3500 confirms higher in the coming weeks.