Bitcoin long term chart
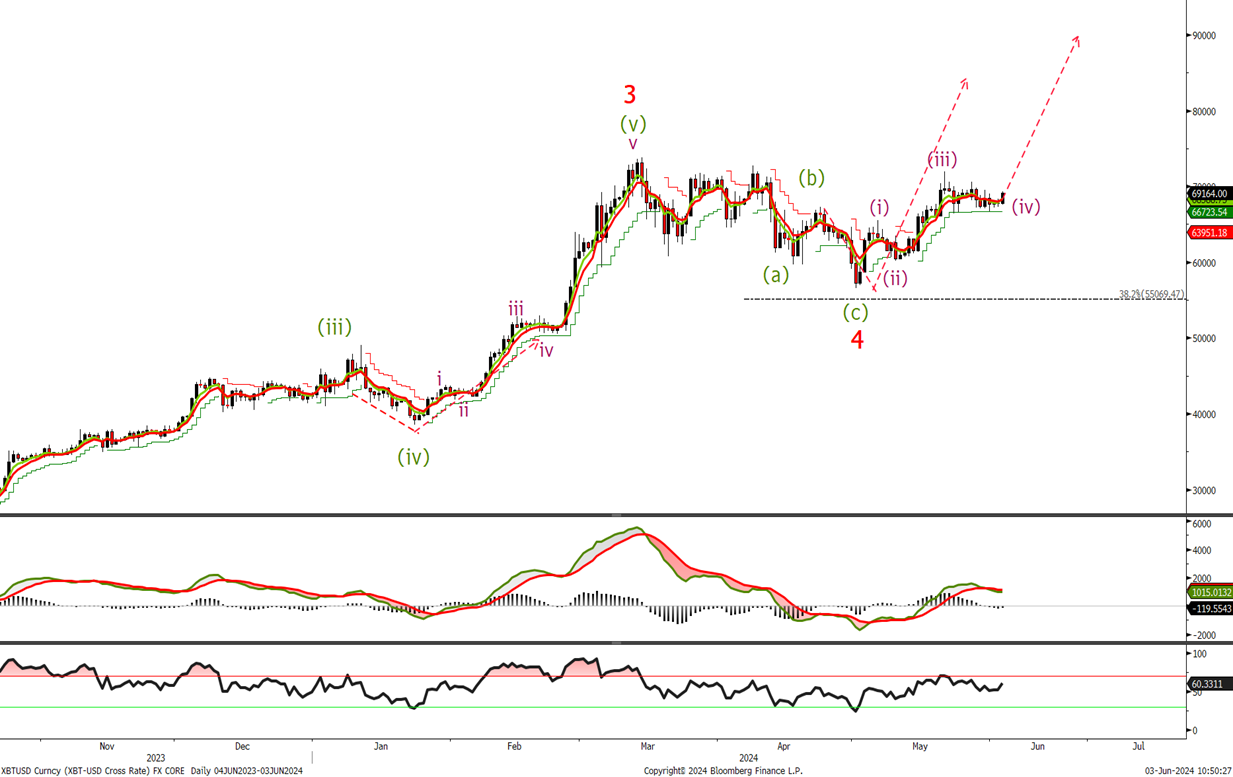
Last time we said ‘BTC sold off perfectly in line with expectations. So we need to look at the short term chart to see if wave 4 is close to ending before we start buying.’ c As you can see we fell just short of 38.2% retracement level before reversing. We continue to look for BTC to trade higher. With stops now below 55K.
Bitcoin short term chart
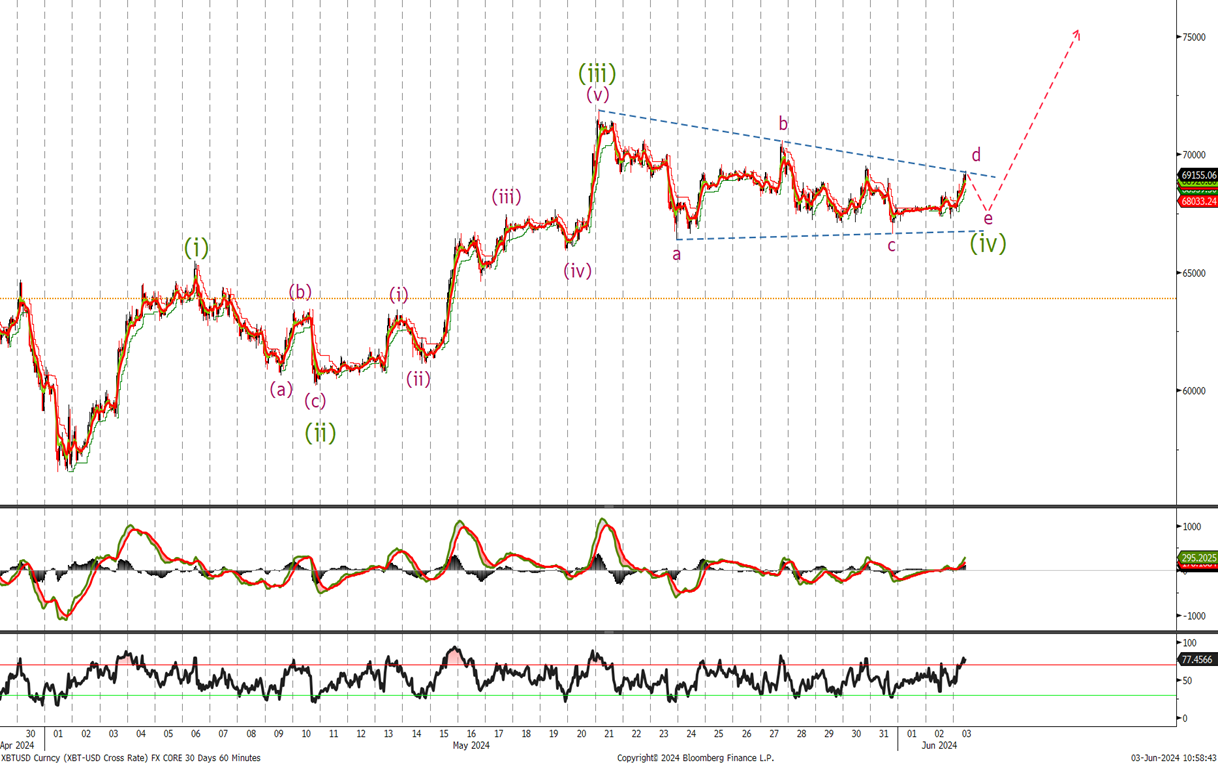
‘As discussed last week we are looking for a sell off into the 49290 to 55000 area where we will look to start buying.’ We traded down to 56500 level before bottoming out and rallying to the wave (iii) high at 71929. It looks to me as if we are in a corrective wave (iv) triangle and I would buy now at 69100 and again at 67500 with stops just below the 56500 low.
Ethereum long term chart
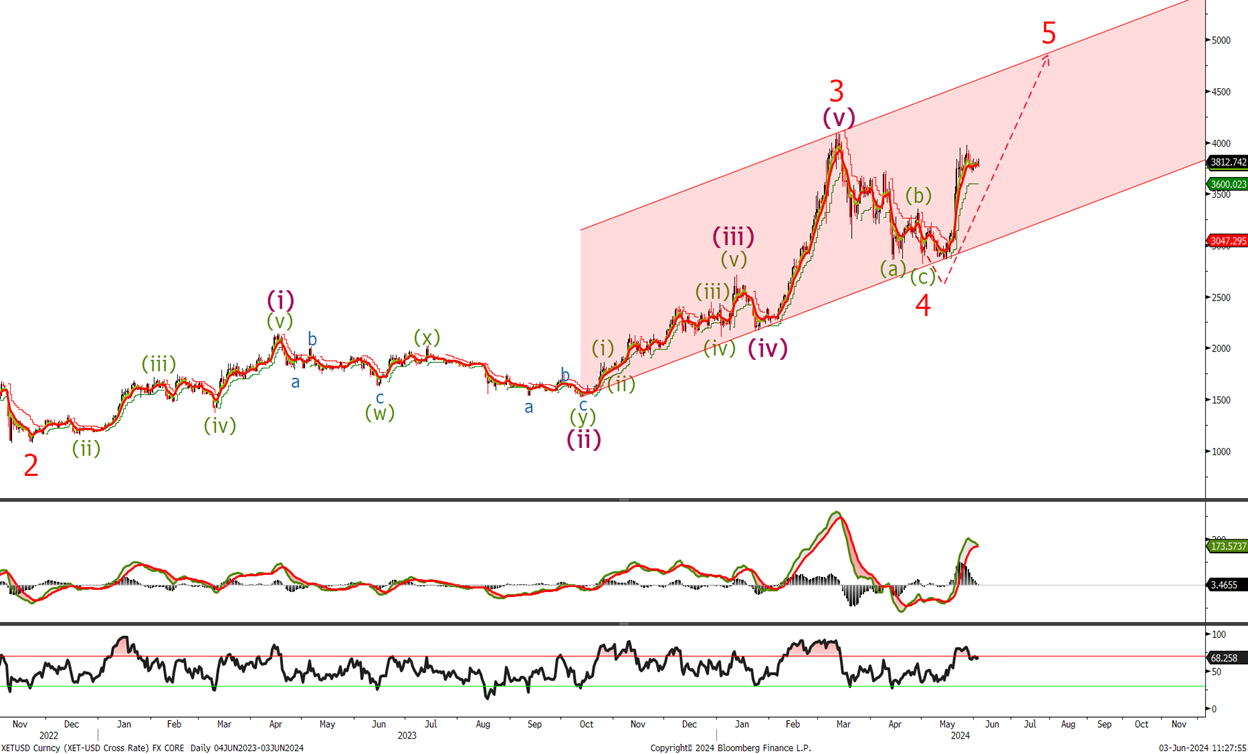
Last time we said ’Look to buy in the 2590 and 2300 level. For a move back above 5000.’ We didn’t trade low enough to get long before the bounce higher started. Lets look at the short term chart to see where we stand currently in this wave 5 higher.
Ethereum chart
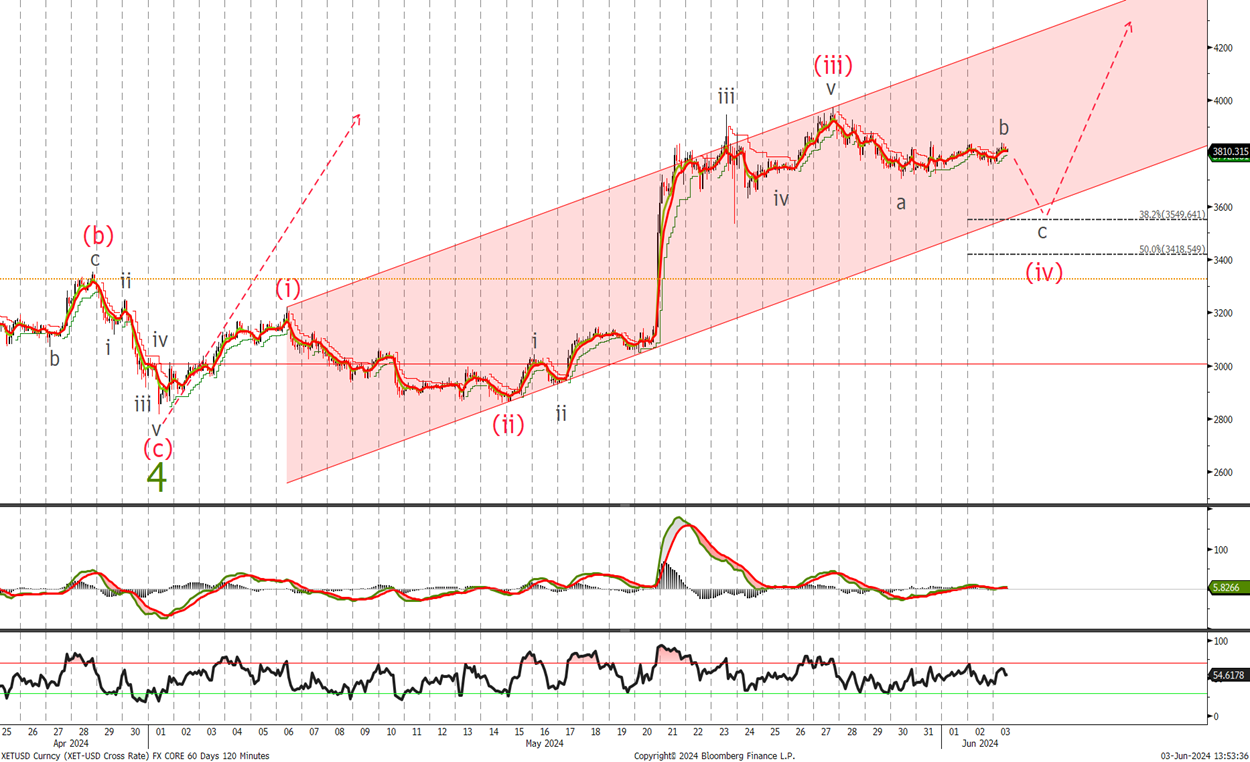
Last time we said ‘a break of the 3740 will confirm that wave 4 is in place and the bull market higher is back underway.’ We traded to 3974 so confirming that wave 5 higher is underway. In the short term I expect to see a pullback into the 3520 -3430 area and I will start buying at the bottom of the channel and add on the any further loses. We should stay above 3220 a break there will nullify this count.
