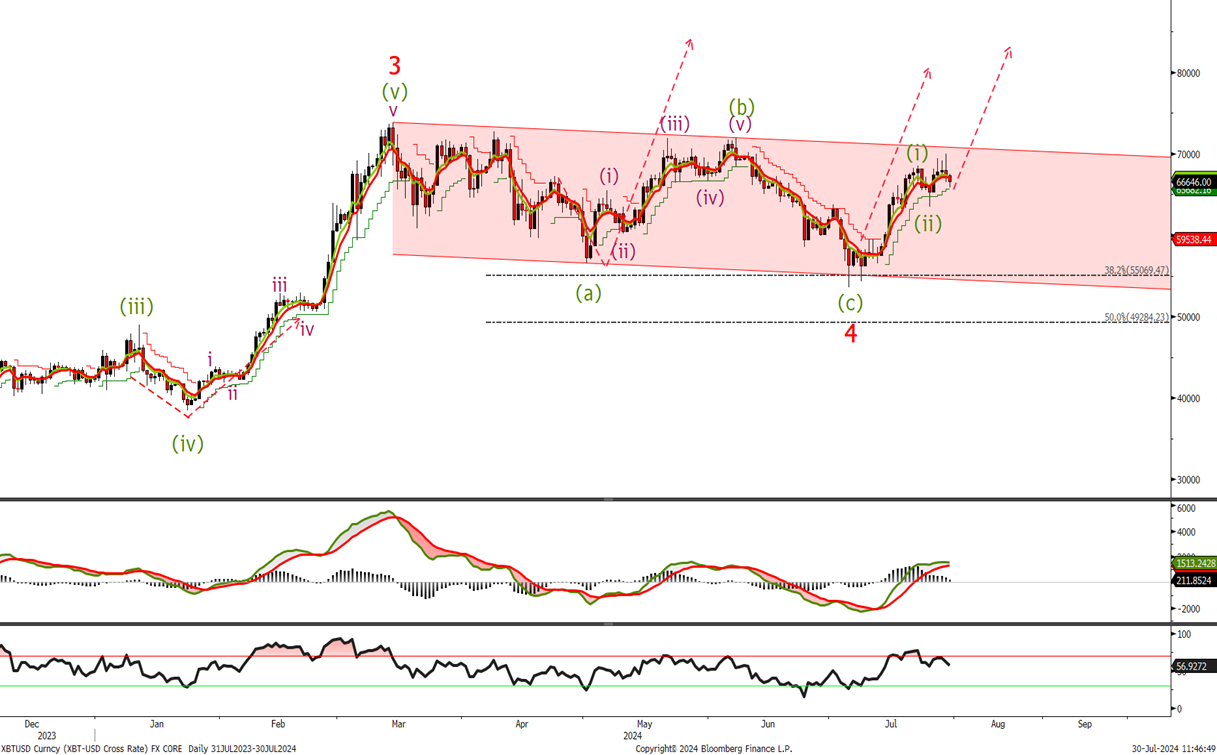
Bitcoin long term chart
Last time we said ‘We traded down to 53600 . it doesn’t negate our longer term bullish view.’ You can move stop losses up to the wave 4 low on long positions as the BTC appears to have completed it correction in the long term and use any dips to buy. So s last time lets look at the short term to see where this buying opportunity may arise.
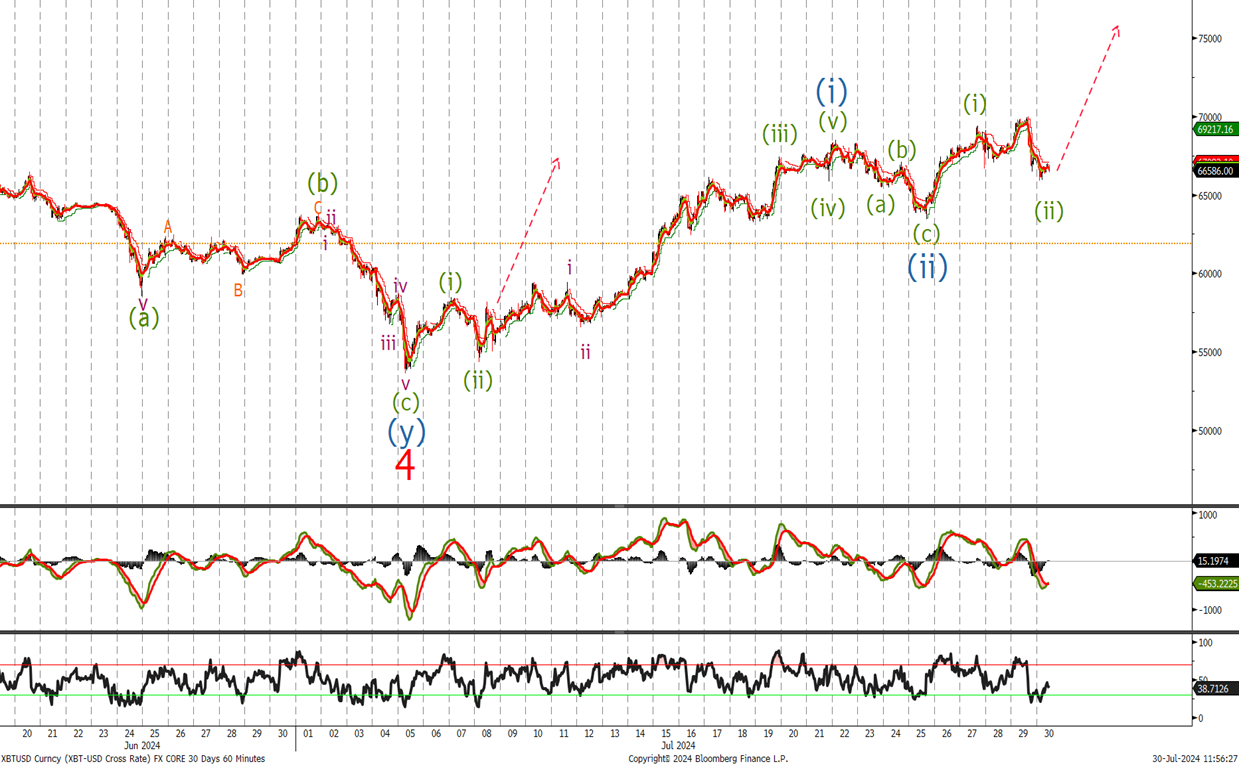
Bitcoin short term chart
Last time I said ‘Well we got stopped on our longs at 55k So I am rebuying the long back at current levels with stops below 53k’ and I am very happy we did as it has traded higher since. The first leg of wave (iii) looks complete and I don’t see much further downside. Happy to buy BTC now and add at 63k raising stop loss to 58 k in the short term . Only a break of wave 4 low will negate the bullish trend.
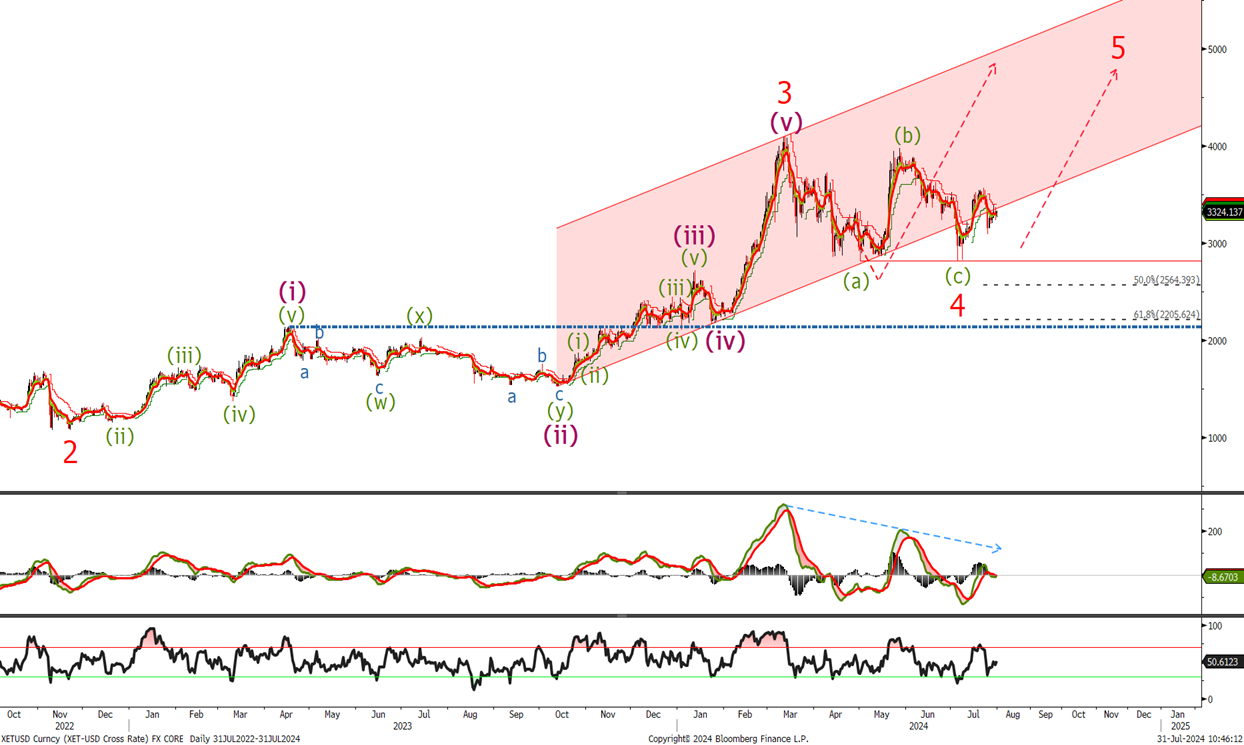
Ethereum long term chart
No real change from last time with ETH actually lagging in performance compared with BTC. We remain bullish long term but lets look at the short term to see where we are and if a buying opportunity is available.
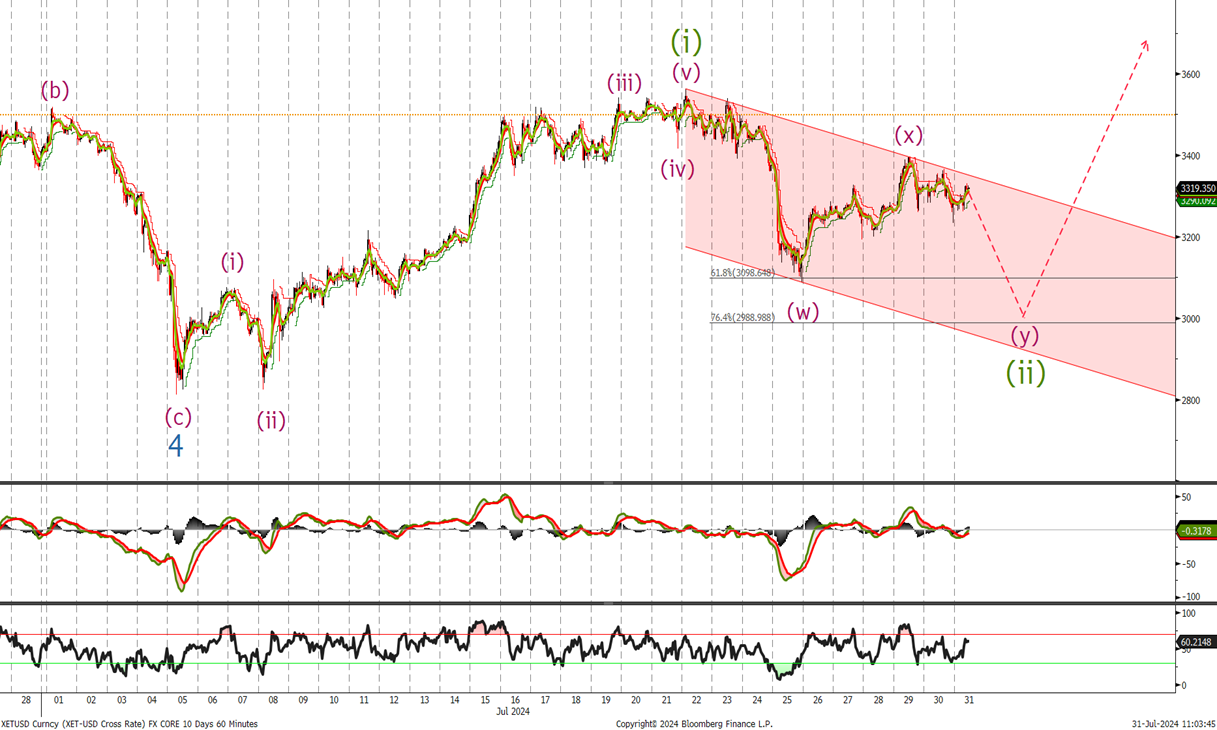
Ethereum short term chart
We still haven’t broken above the 3500 level we were looking for to confirm the next leg higher in the coming weeks. I think we are currently correcting lower and should see a move back into the 3000 – 3100 level. Look to buy down there with stops at 2770.