Bitcoin short term chart
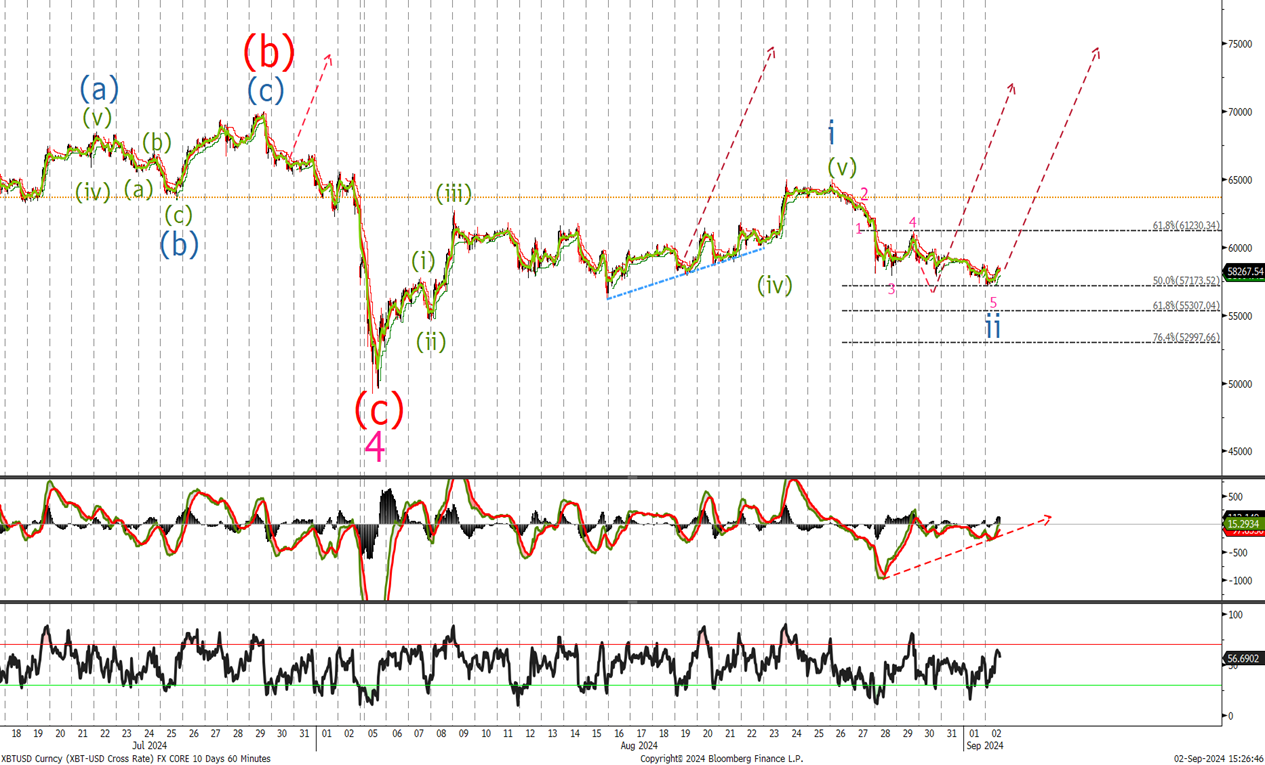
Last time we ‘If a pull back to the 53500 area add to longs there with stops below 48800.’ Looking at the short term chart it look like we will have one more break push lower and I would raise my buy level to 55500. ‘ Leave stops at the wave 4 low. I ma buying now at 58300 will add at 55300 and against 53 k with stops at last weeks levels below 48800.
Ethereum short term chart
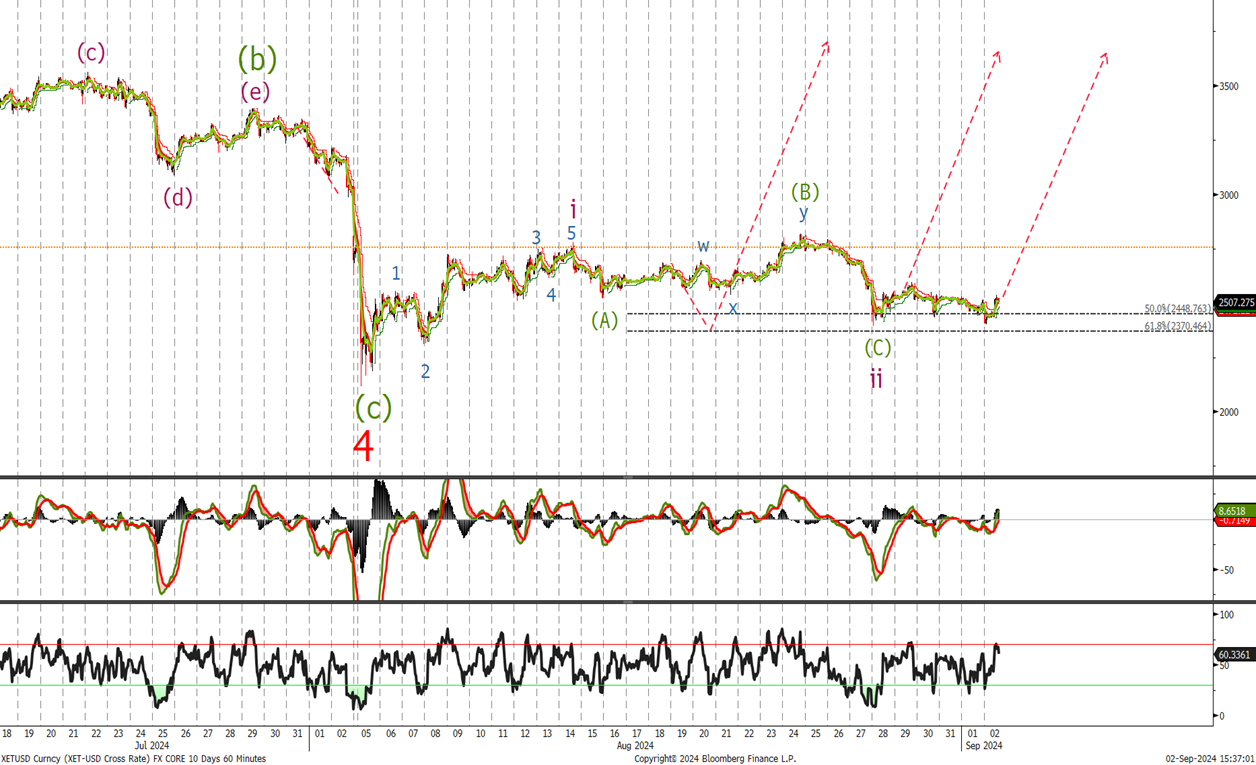
Last Thursday we said ‘I like ETH higher and am buying some now and will add at the 2448 and , 2370 and 2270 with stops at 2075’ Given the price action and momentum I believe having already bought at the 2448 level , we fell just shy of the 2370 level stopping at 2402 , but I remain bullish and looking to buy using last weeks levels as a guide.