Bitcoin Short Term Chart
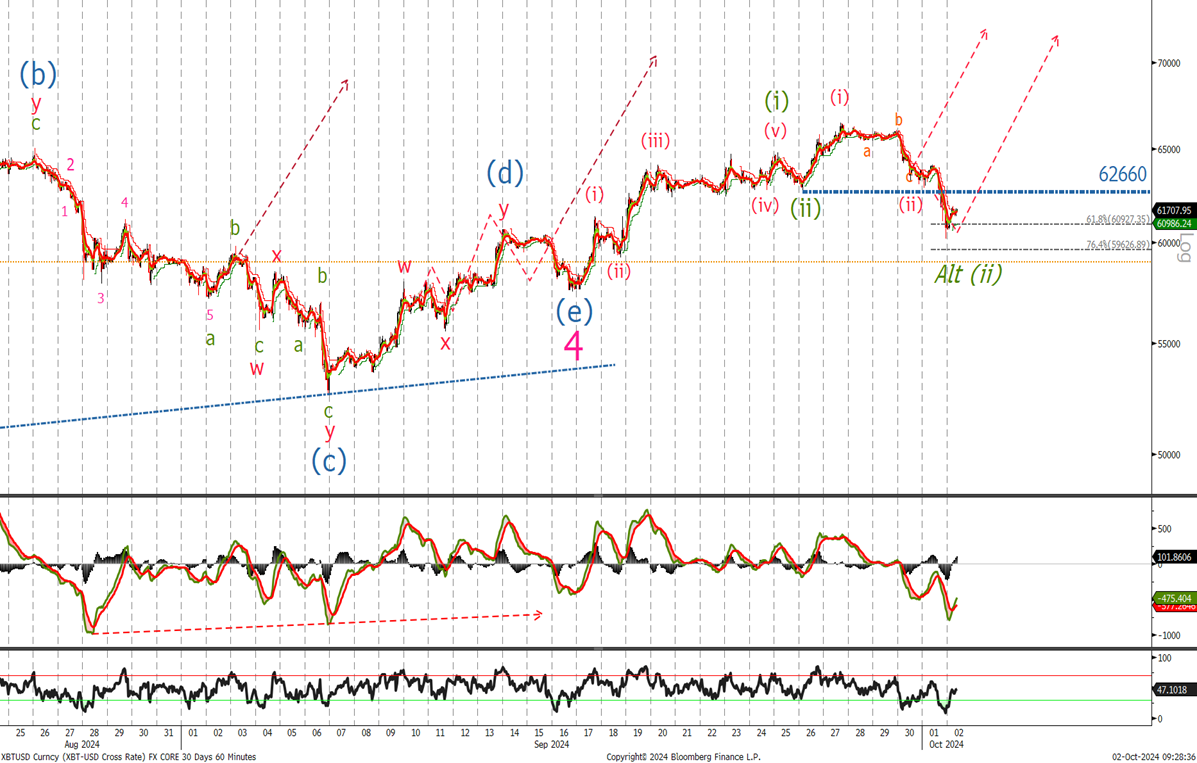
Last time we said ‘it appears , as is often the case we are tracing out a wave 4 corrective triangle. Buy now or on a slight dip and leave stops at last weeks levels a move back above 65k will indicate that wave 5 is underway.’ As you can see from the previous arrow the correct call was the triangle and we have traded up to 66480 so I am saying wave 5 is underway. I am buying now at 64130 and if we break the wave (ii) low at 62660 , it doesn’t negate the bullish call and we will use this sell off to add at 61k and 59600 with stop below the wave 4 low at 57300.
Ethereum chart
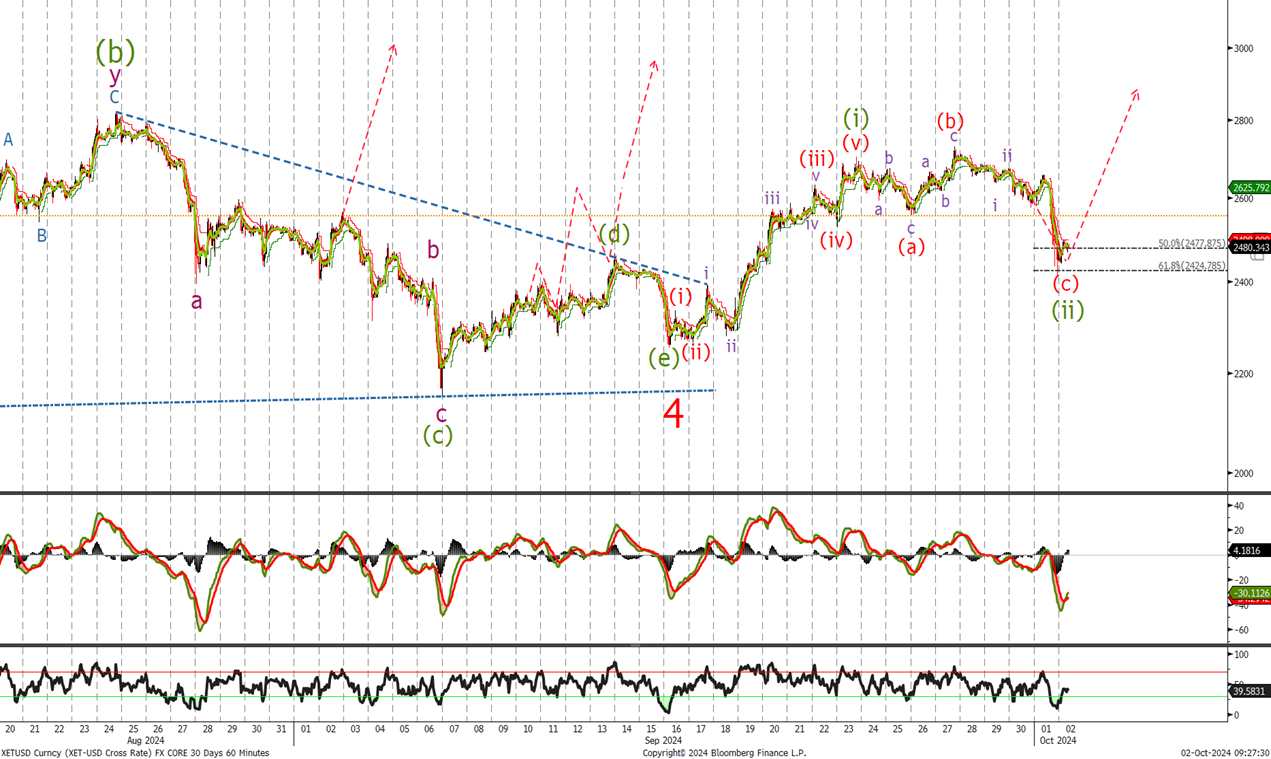
Last time we said ‘. Like BTC I am showing a corrective triangle So if correct look to buy if not already long with stops place somewhere below 2100.’ We are already long as we didn’t hit stops at 2100.Look to buy now on any retracements below 2477 and add again at 2425 with stop below 2250.
Solana short term chart
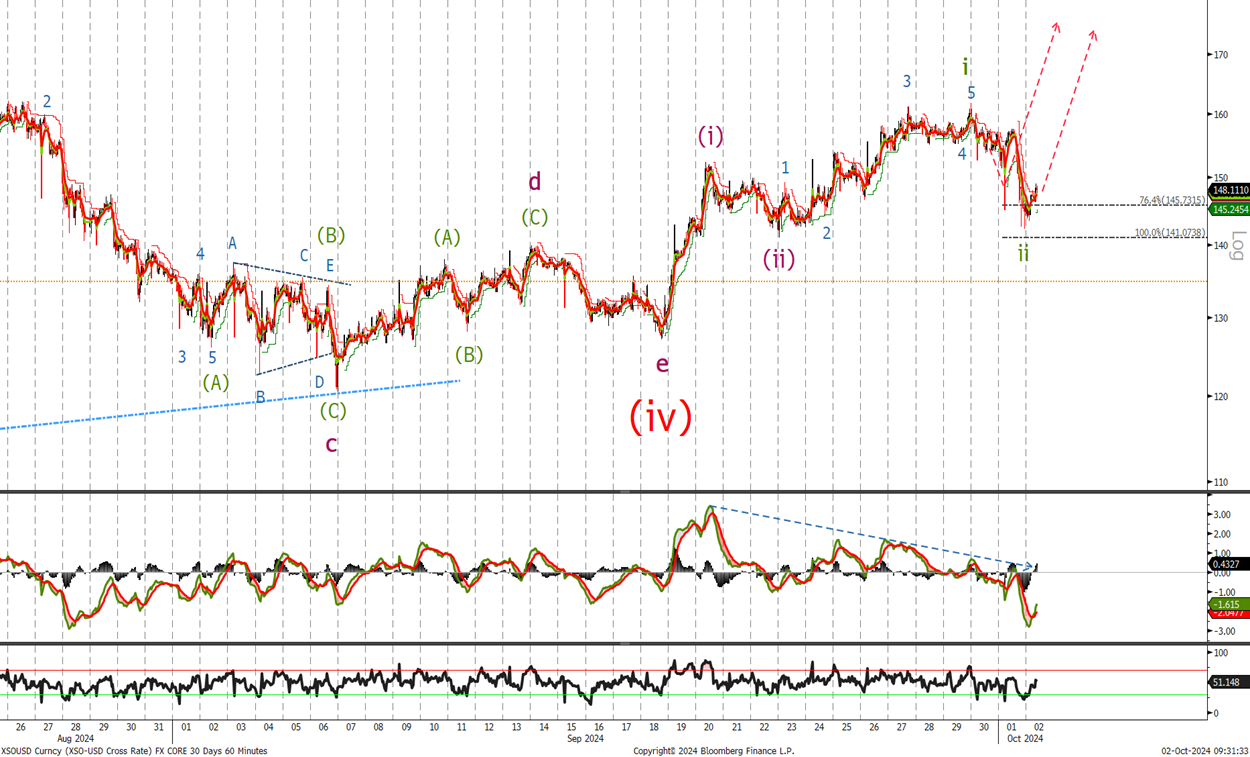
Last week we said that we would and see if traded lower as was my first week covering this coin. I am glad I did as Solana followed the same pattern as BTC and ETH tracing out a corrective triangle for wave (iv) . It appears that the bullish trend resumed in mid august. Look to buy on dips in the 148/152 area and 140 with stops below 126.