Bitcoin short term chart
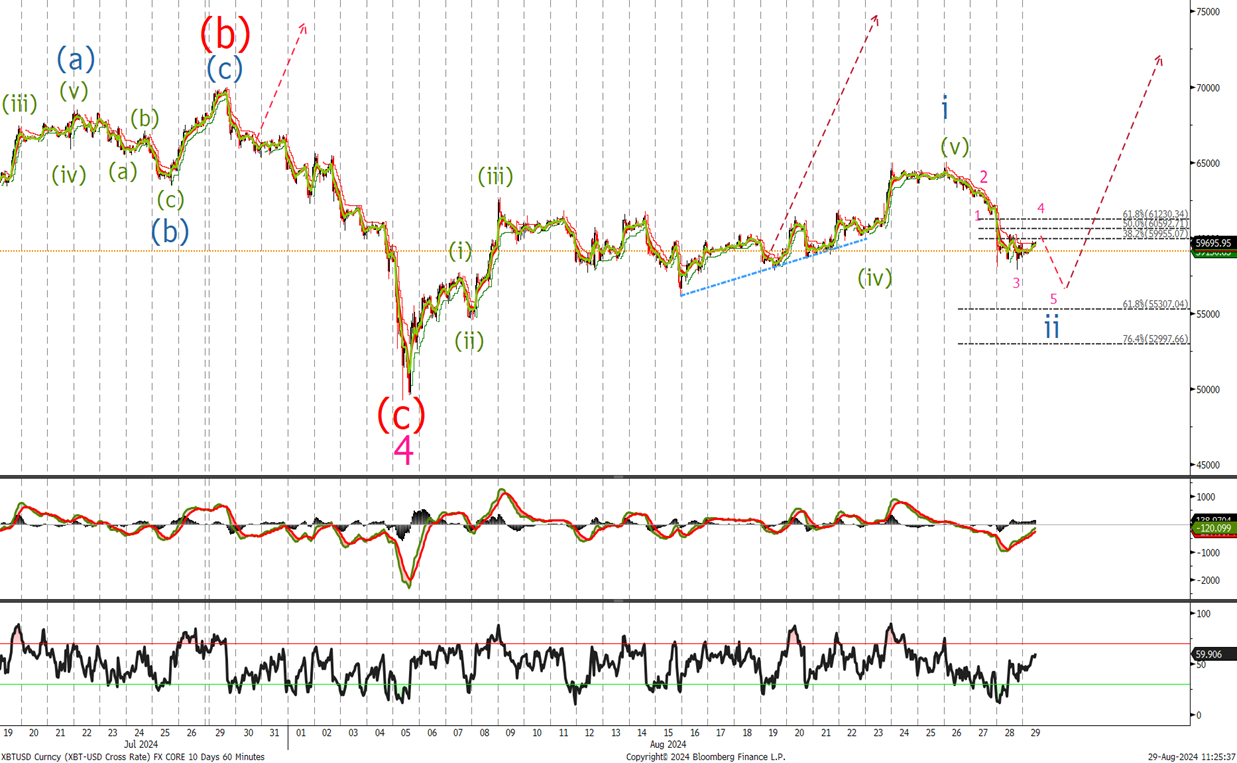
Last time we said ‘I am building again a long position and rebuying now with stops at the 48800 level . If a pull back to the 53500 area add to longs there.’ Looking at the short term chart it look like we will have one more break push lower and I would raise my buy level to 55500. Leave stops at the wave 4 low. There is a view that wave 4 is still unfolding which could see a test of 43.3k before wave 4 complete , I will update that view if its becomes a great probability.
Ethereum Chart
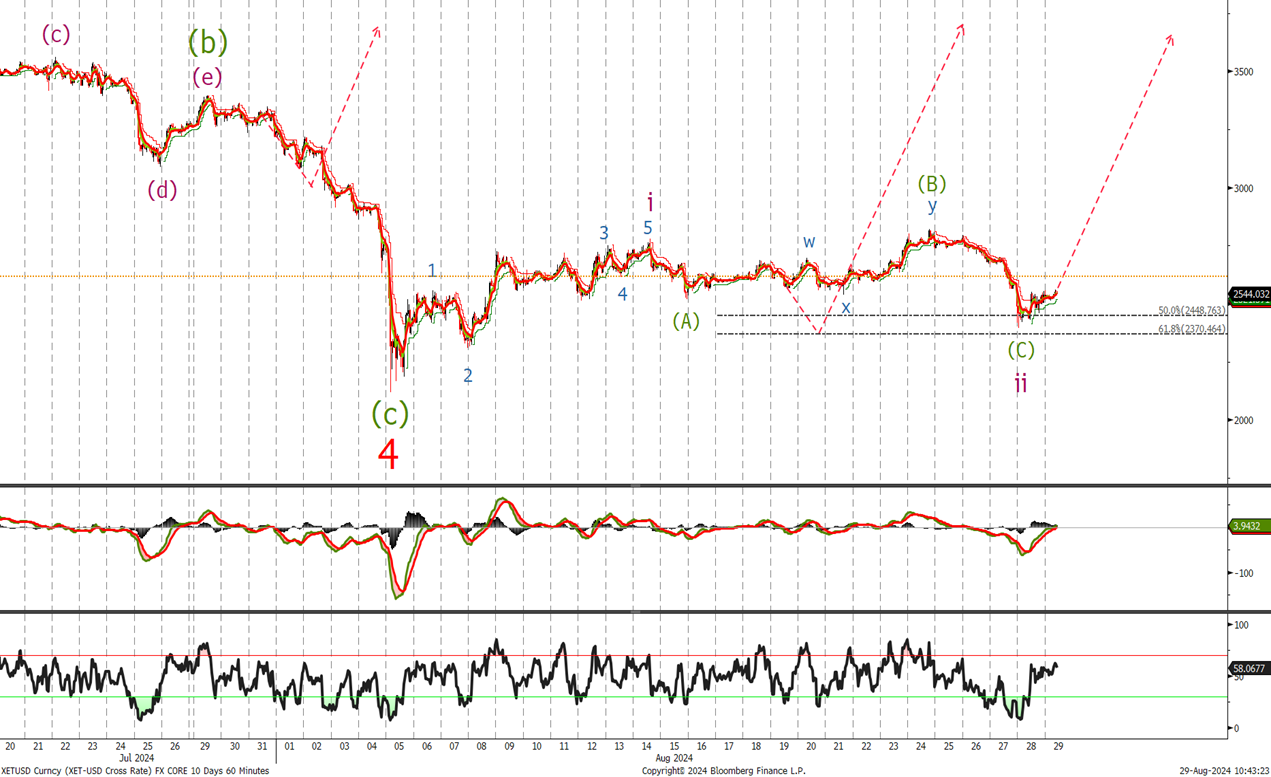
Last time we said ‘I like ETH higher and am buying some now and will add at the 2448 and , 2370 and 2270 with stops at 2075’ Like BTC there is a possibility that we may trade slightly lower to the levels mentioned last week , if that happens then we will add to our longs expecting an acceleration to the topside imminently.