Bitcoin Short Term Chart
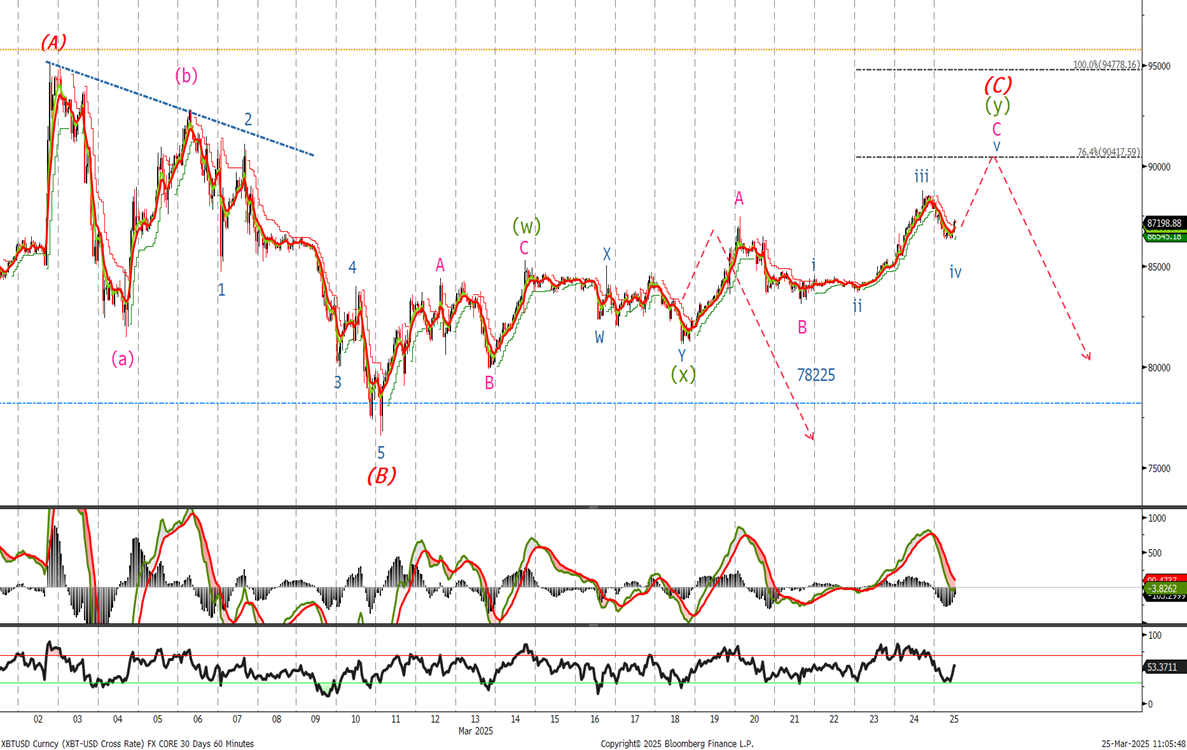
The long term bullish view remain unchanged but we were looking to see if the correction had ended and said ‘It looks to me that we should have one short term push into the 85555 - 87770 region where we would sell our BTC in the short term expecting to see a sell off towards the bottom of the channel. I will look to start buying just above 70k with a move below 58700 closing longs and reassessing the view.’ The correction seems to be still unfolding and breaking the wave count down it would despite already trading to 88185, enabling us to get short. I am happy to stay short and add on a new high towards the 90400 level. Use last weeks levels to by and if short stop and reverse on a move above 95k.
Ethereum Short Term Chart
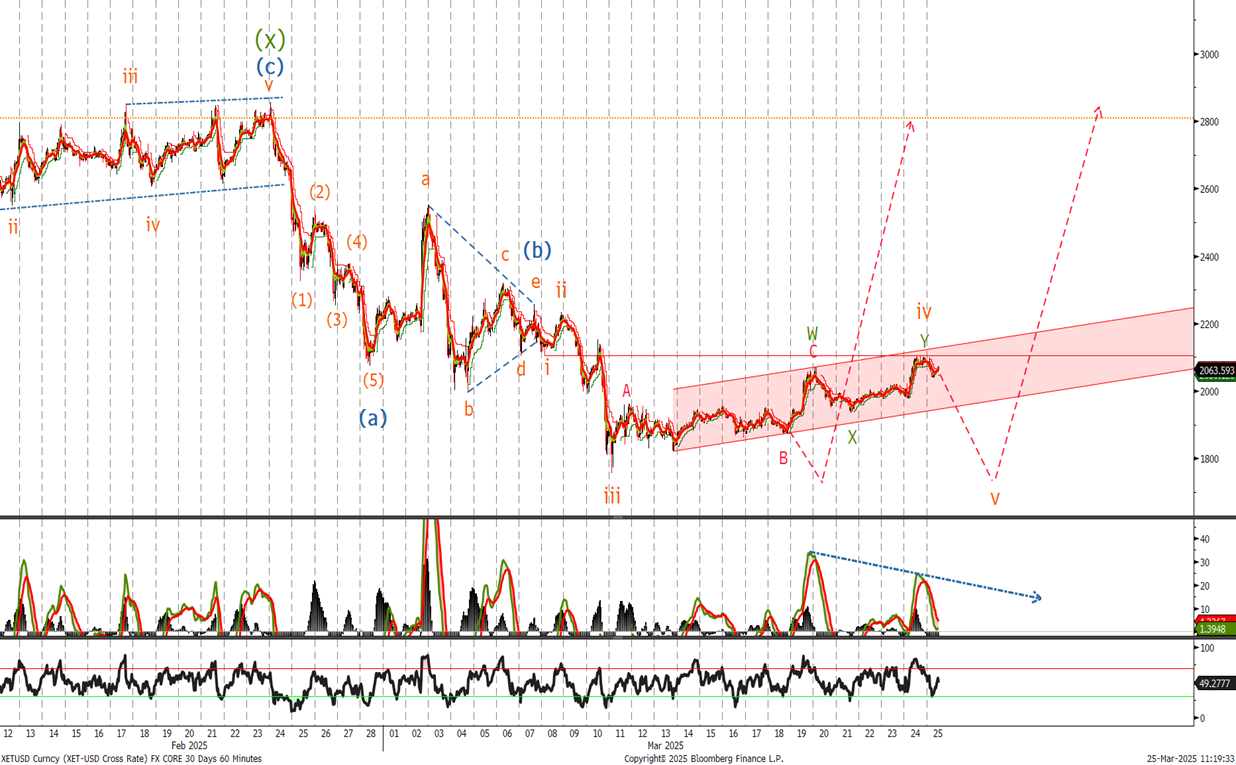
Last time we said ‘ the view remains the same that we trade lower. Place buy levels now 1660 and again at 1480. We will look for signs of a low - Stops are far away at 870.’
I believed the correction was over and we were entering the final leg lower. I must admit to being slightly lost on ETH but given we have reached the resistance on the topside and the bearish divergence in the MACD I am still on the look out for a final push lower. A move above 2270 will negate the bearish view and confirm the correction ended at what I am showing as wave iii.