Bitcoin Daily Chart
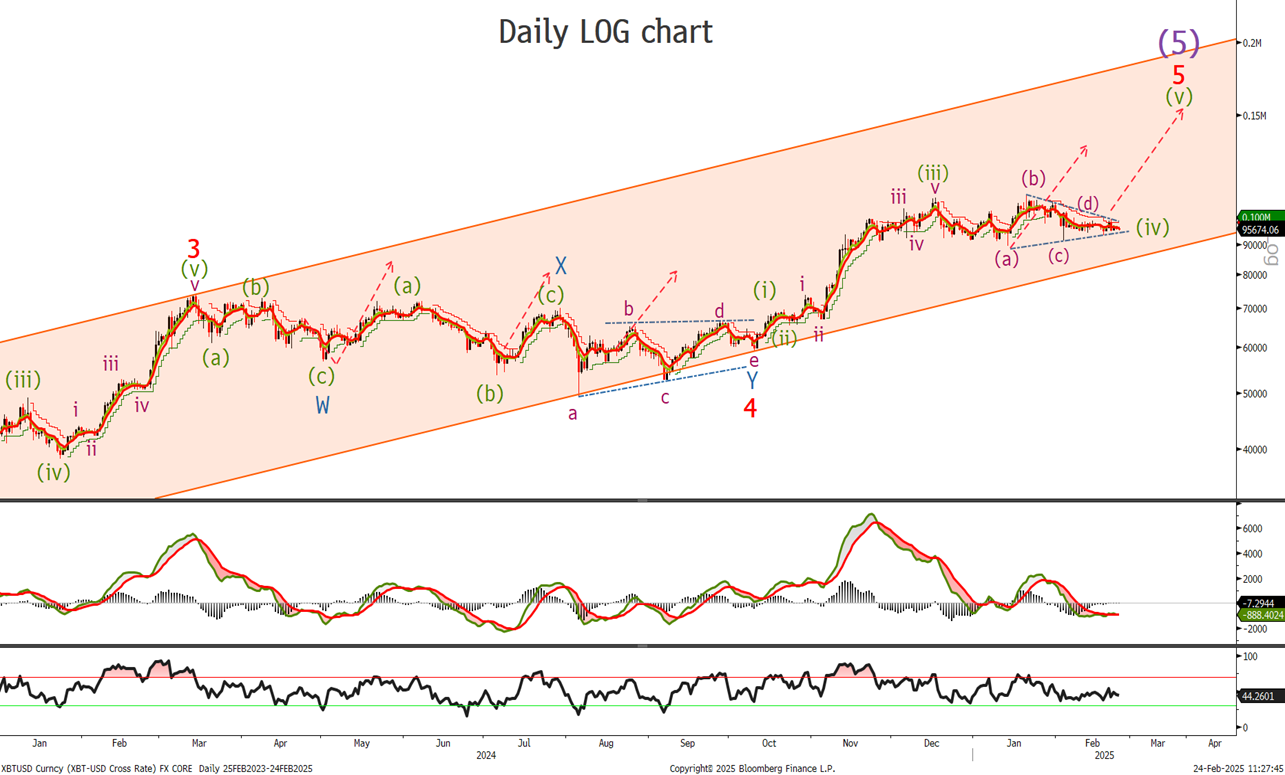
No change from last week in the daily chart with the corrective triangle discussed over the previous 3 weeks is continuing to trace out. Lets go to the hourly to see if wave (d) of the triangle is close to or already completed.
Bitcoin Short Term Charts
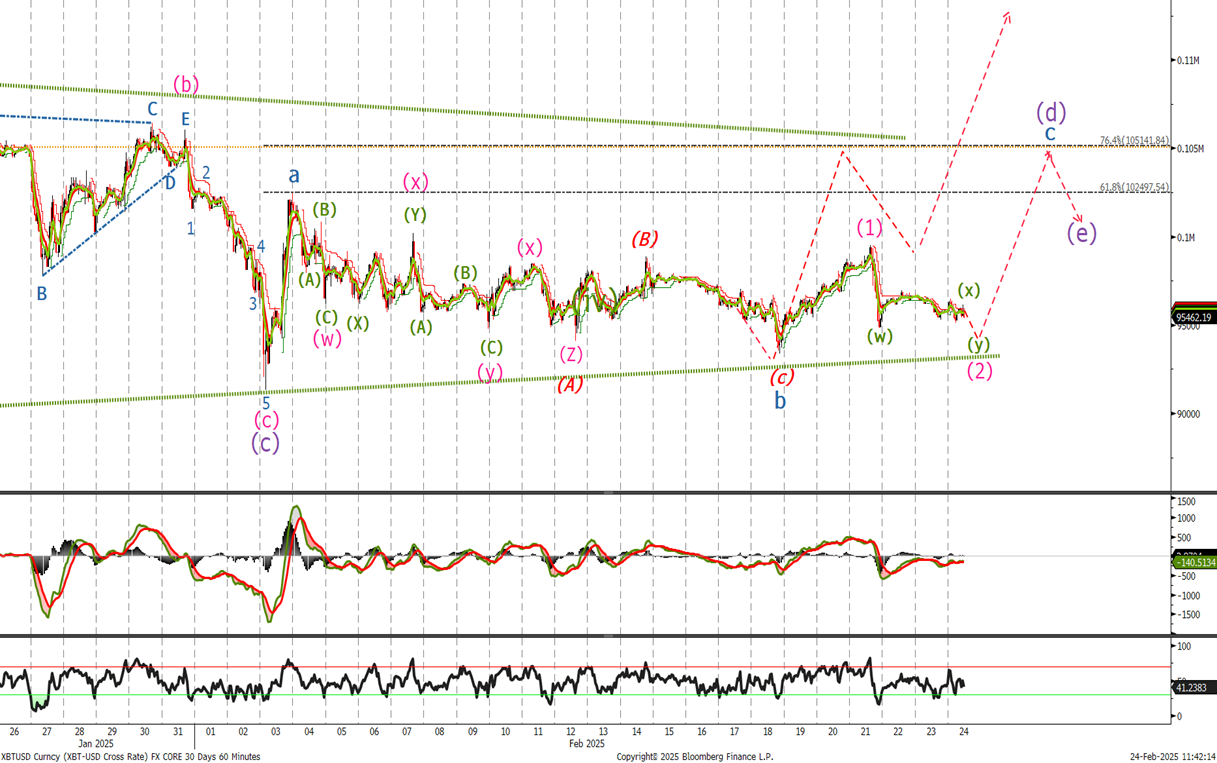
Last week we said ‘The sideways trading continued all week and it looks like we may have a slight new low below the wave (A) where we would buy leaving stops at last weeks levels. The next couple of days should provide a great burying opportunity.’ We broke the wave (A) in line with expectations, allowing us to buy reaching a low of 93362. With our stops remaining at 91304. It does appear we have a slight new low again to come below 94815. I will buy there and am,, happy to remain long leaving stops there but a break below does put this current bullish count in doubt. I will redo if this becomes reality.
Ethereum Medium Term Chart
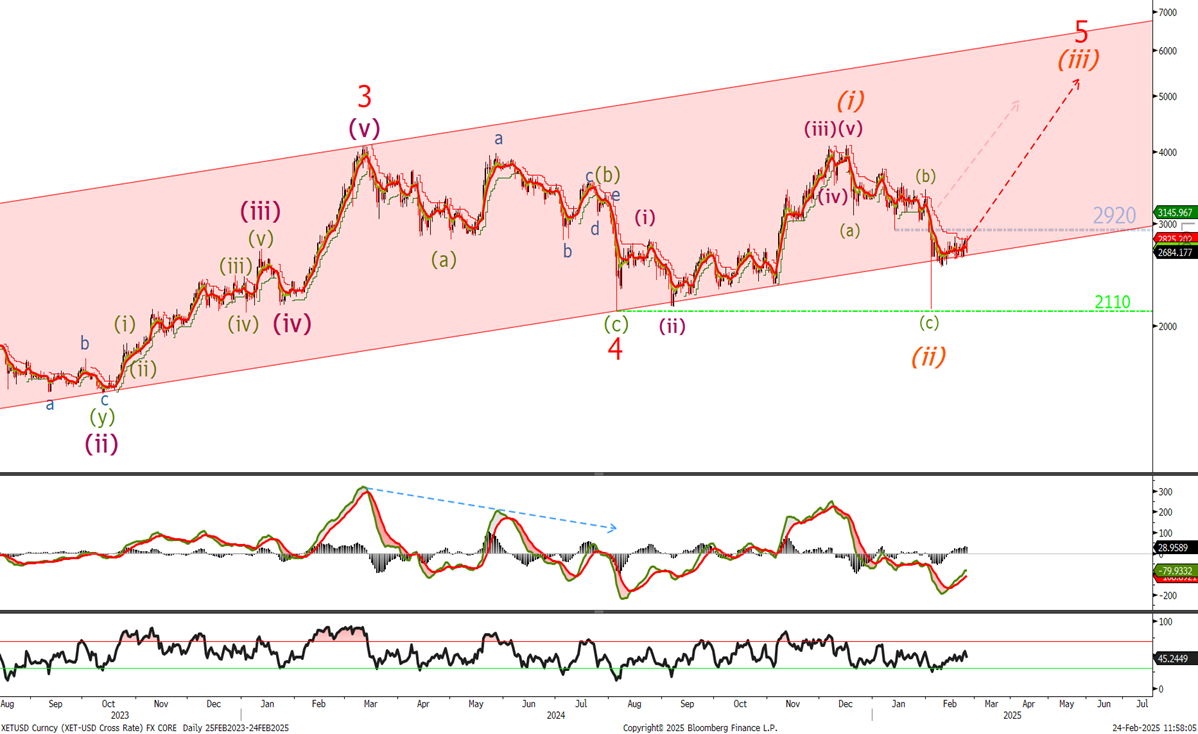
No change for the long tor the longer term view.Last time we said ‘ This view remains valid and if not long buy now at 2650 as we test the bottom of trend channel. Using the wave 4 low 2110 as the stop level.The low so far was 2548 so if not long can buy now at 2720.’
The low so far was 2605 in what really has been sideways corrective trading . If not long buy now at 2690. I am not expecting a move below 2500 but if we do I will redo the wave count. Till then I remain bullish.
Ethereum Short Term Chart
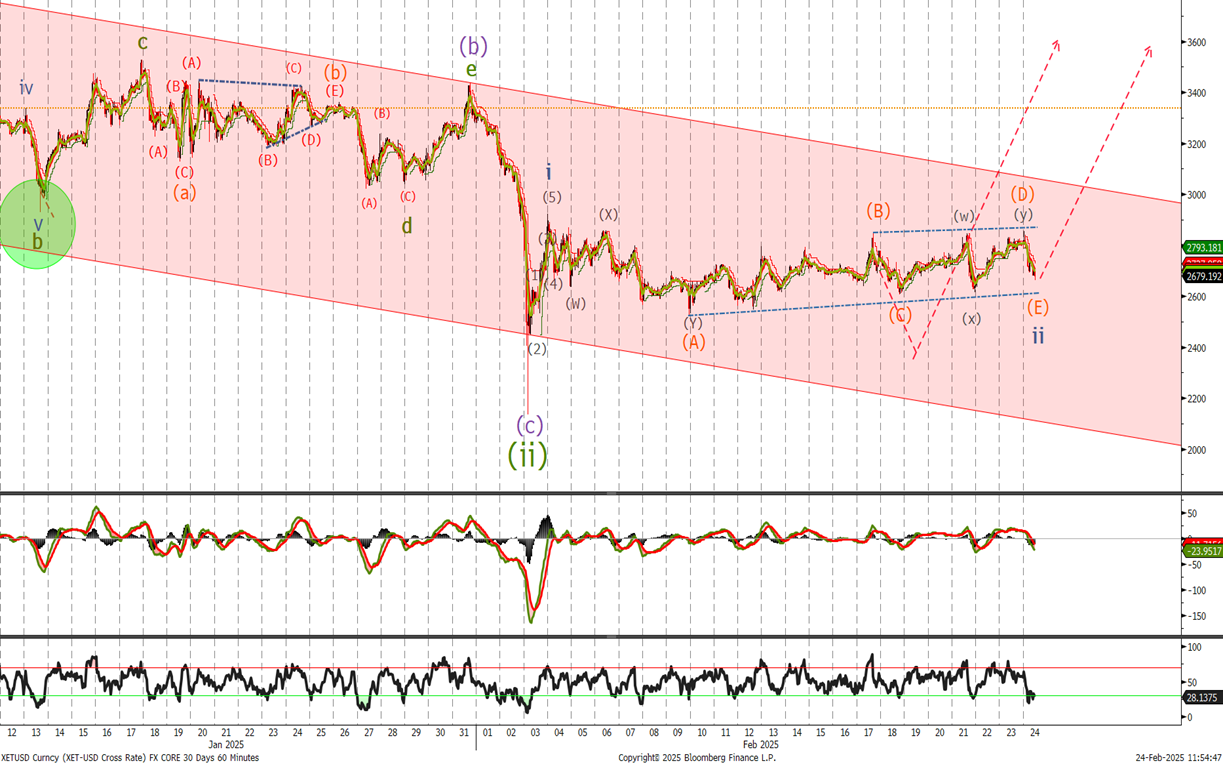
Last time we said we could ’Possibly trade down to 2450 and the bottom of the channel. Start to add to longs below the 2548 low with stops remaining below 2135.’
I was looking for a zigzag correction so we never saw the levels I was hoping to buy. Instead we appear to be tracing out , and I think ending at any moment a wave ii corrective triangle. Buy now at 2690 and use the same stop levels as the long term chart.