Bitcoin long term chart
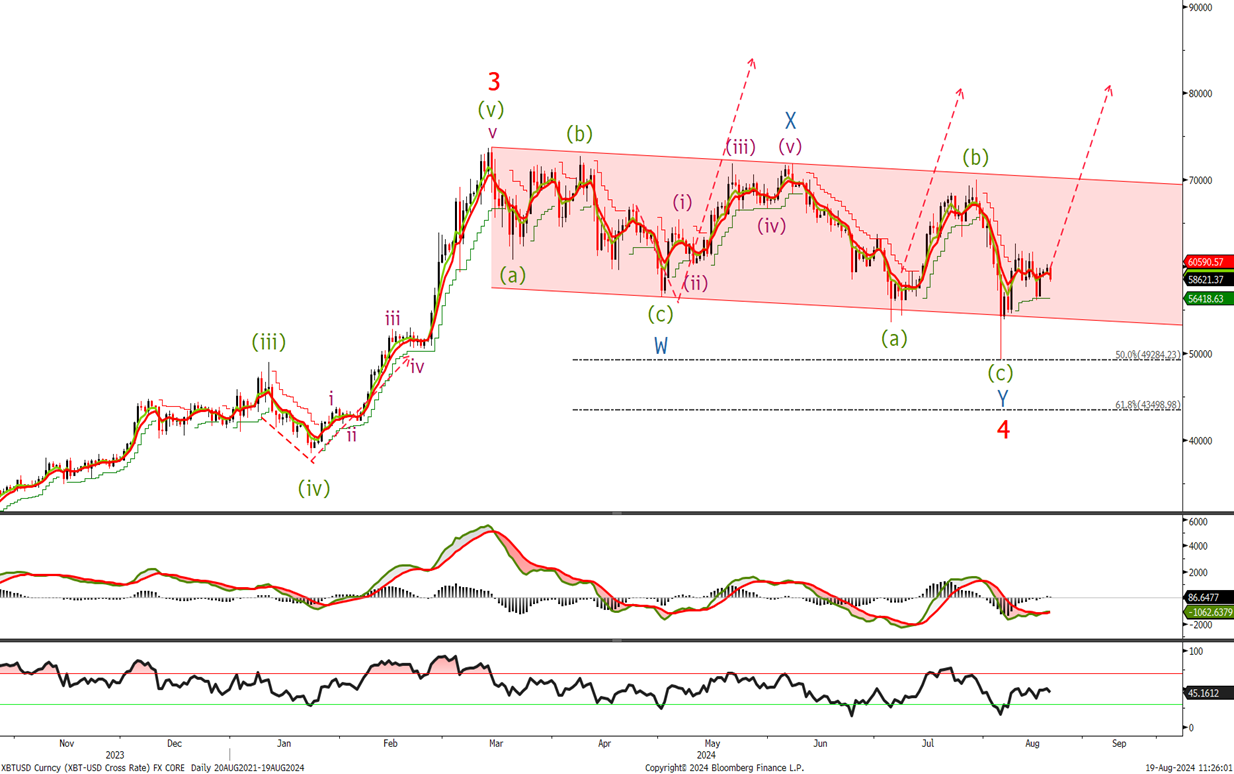
Last time we said ‘move stop losses up to the wave 4 low on long positions as the BTC appears to have completed it correction in the long term and use any dips to buy.’ I was not expecting the correction to continue and looking at the sharp sell off I don’t think I was the only one wrong. However we did say buy on dips and as you can see we stopped at the 50% retracement level.I am once again calling a low in place and buying now with stops below 48800.
Bitcoin short term chart
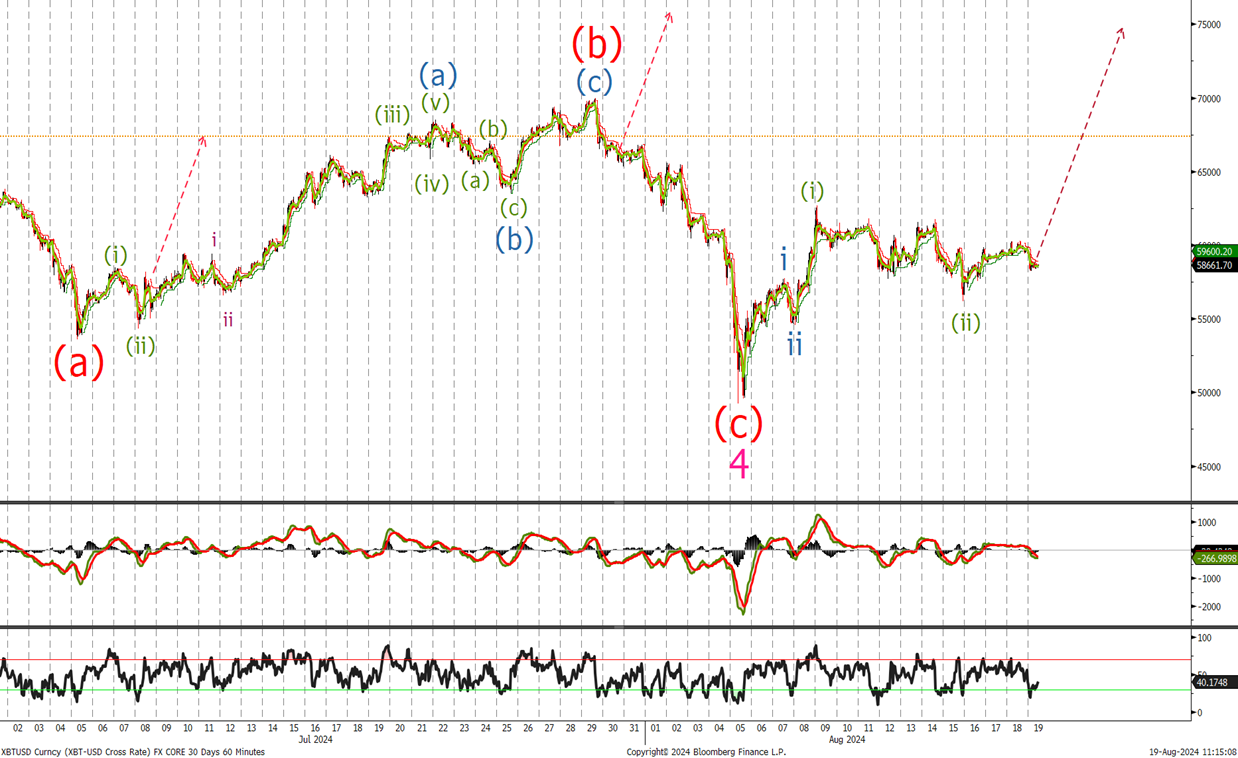
As previously mentioned we were not expecting an extended wave 4 correction and got stopped on our longs. Since making that low I am building again a long position and rebuying now with stops at the 48800 level . If a pull back to the 53500 area add to longs there.
Ethereum long term chart
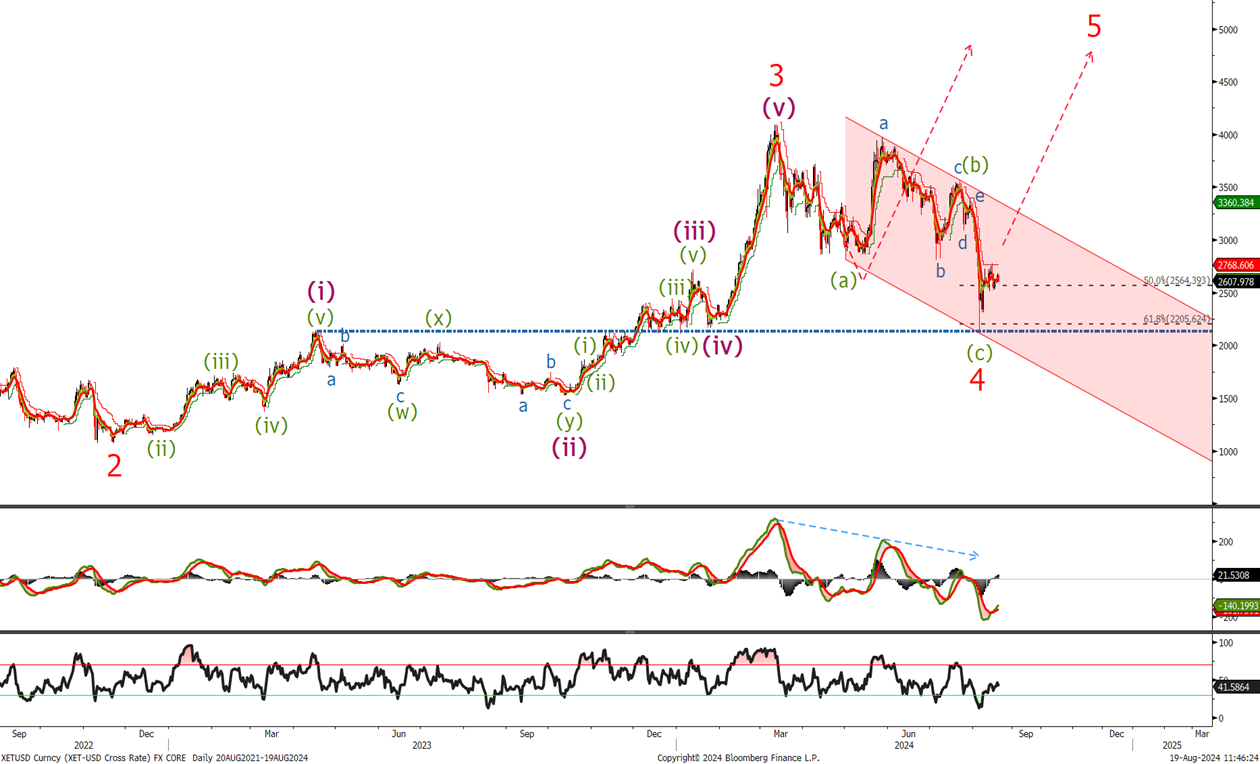
Like BTC we were stopped on longs as the ETH corrected further than BTC and stopped at the area of the previous wave (i) high as well as the 61.8% retracement level. I am buying now at 2768 and will add to longs on a break out the channel and a move back above the 3600 level. Place stops below the wave 4 low at 2075 area.
Ethereum short term chart
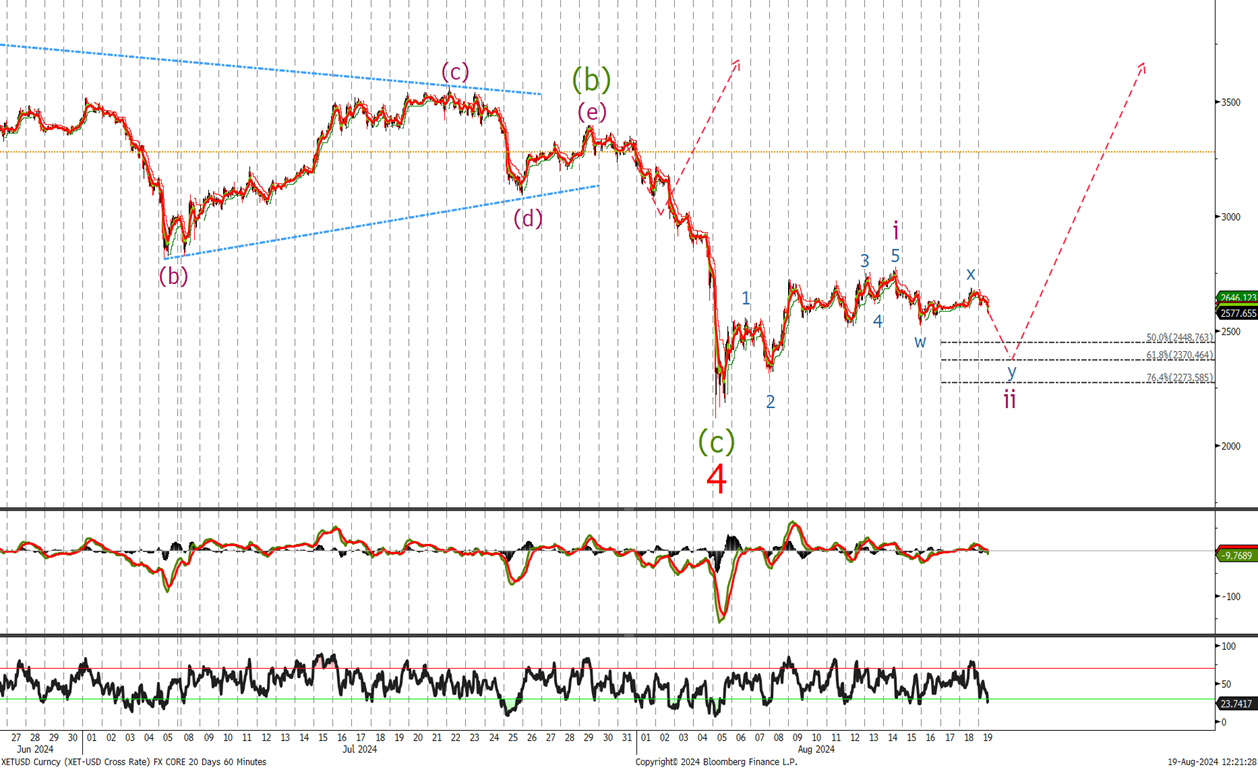
Last time we said ‘We still haven’t broken above the 3500 level we were looking for to confirm the next leg higher in the coming weeks. I think we are currently correcting lower and should see a move back into the 3000 – 3100 level. Look to buy down there with stops at 2770.’ It didn’t take long to lose on that trade. I like ETH higher and am buying some now and will at the 2448 and , 2370 and 2270 with stops at 2075