Bitcoin Daily Chart
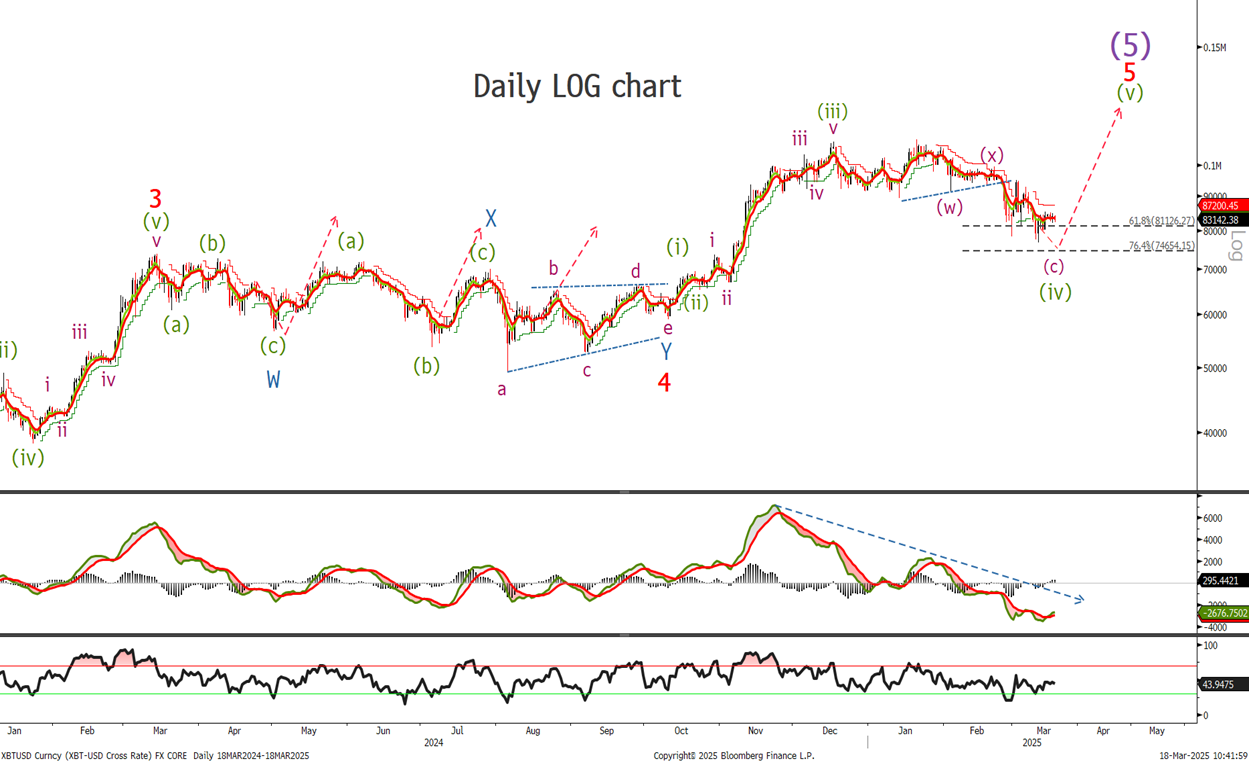
Last time we were looking ‘to see if we are close to ending what is now a wave (iv) correction.We have pretty much traded in what appears to be a choppy corrective nature over the last week.Lets look to the hourly chart to see where exactly we are and if the 76.4% retracement level is achievable at 74655.’
No change in our longer term view and believe we should be close the ending the correction.
Bitcoin Short Term Chart
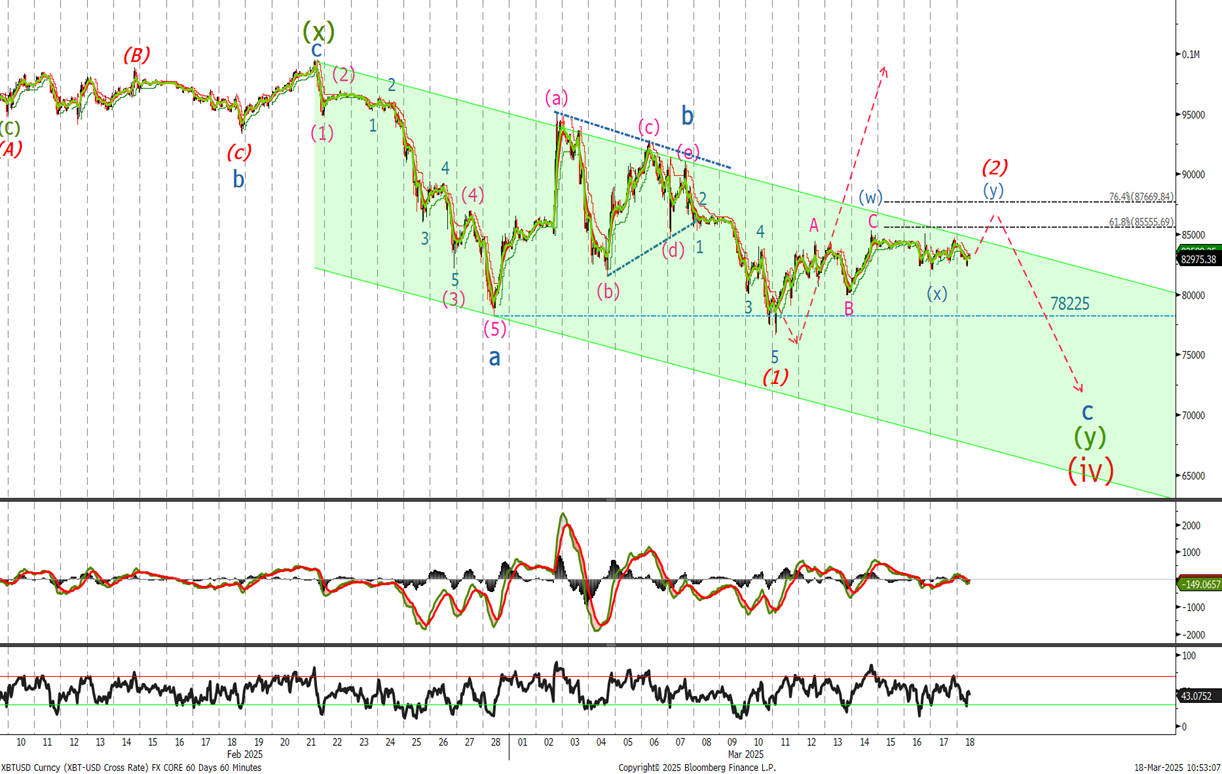
Last week we said ‘It looks in the short term we will push down one more time for a new low below 78225. I would use this level to start buying again. Place stops now at 69200 the wave (i) high on the previous chart. Add at 74650 stops at 69200.’
It looks to me that we should have one short term push into the 85555 - 87770 region where we would sell our BTC in the short term expecting to see a sell off towards the bottom of the channel. Wace C is equal to wave a at 69900 so I will look to start buying just above 70k with a move below 58700 closing longs and reassessing the view.
Ethereum Daily LOG Chart
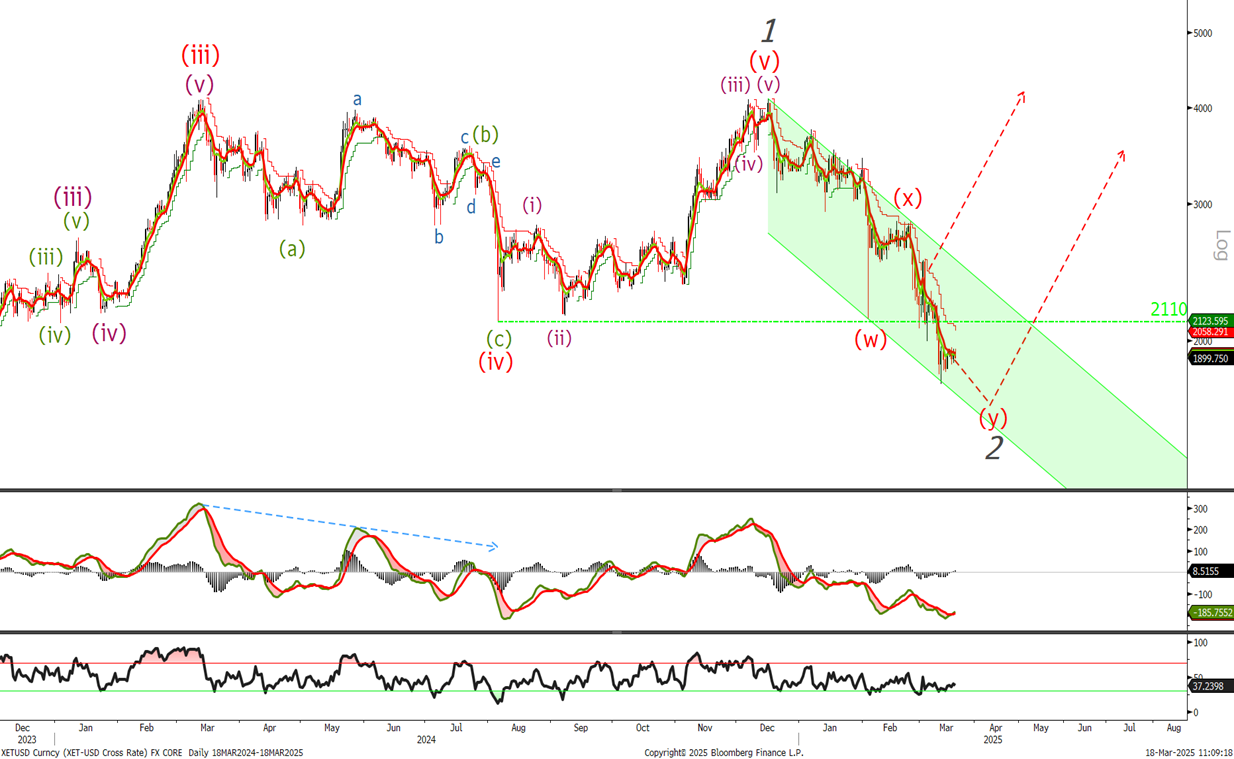
Last time we said ‘We traded lower the minute I sent the last update and broke the 2074 low stopping us out.’
ETH has basically range traded over the last week and we will need to look to short term chart to see if we are close to completing wave 2.
Ethereum Short Term Chart
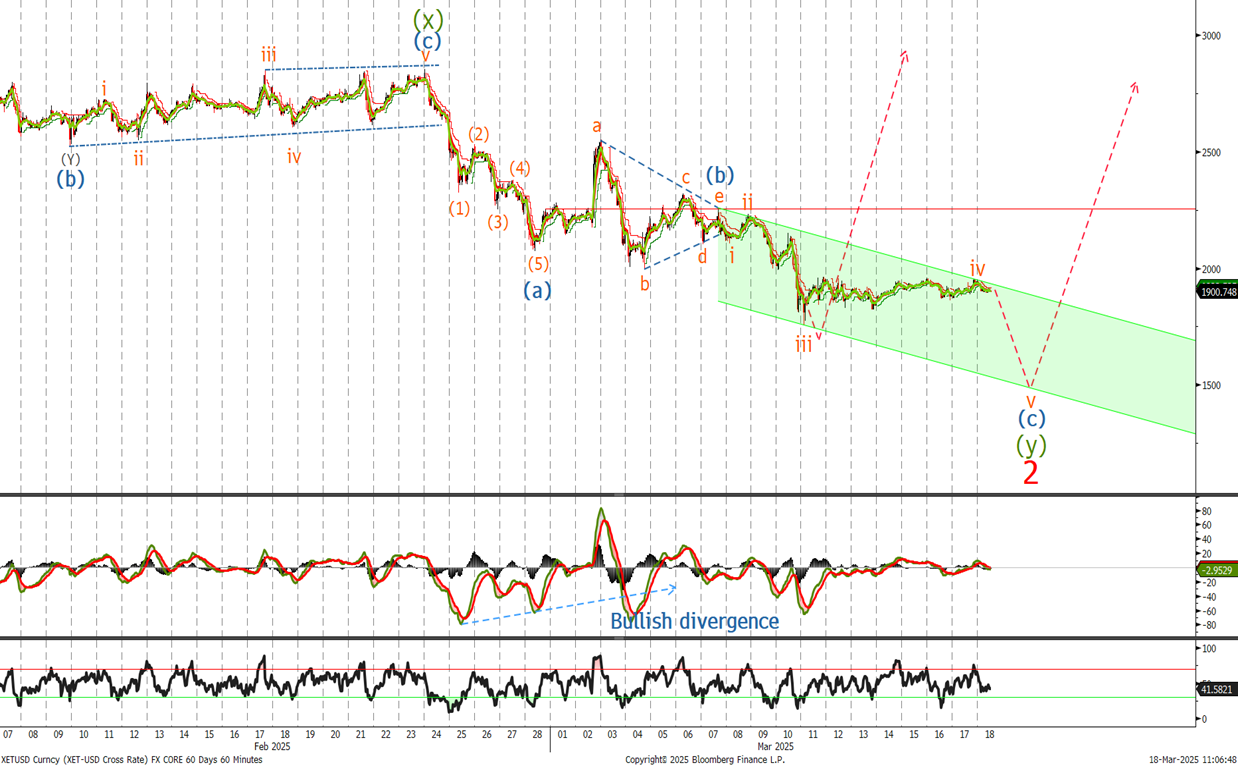
Last time we said ‘I have changed the view and believe we should see a push down towards the 1900 1840 and 1750 level. We would look to buy at these levels . At 1480 wave (c) would equal wave (a) and we would look to buy down there as well although given the wave structure that does look far away.’
I have relabelled the chart but the view remain the same that we trade lower. Place buy levels now 1660 and again at 1480. We will look for signs of a low - Stops are far away at 870.