Bitcoin weekly Chart
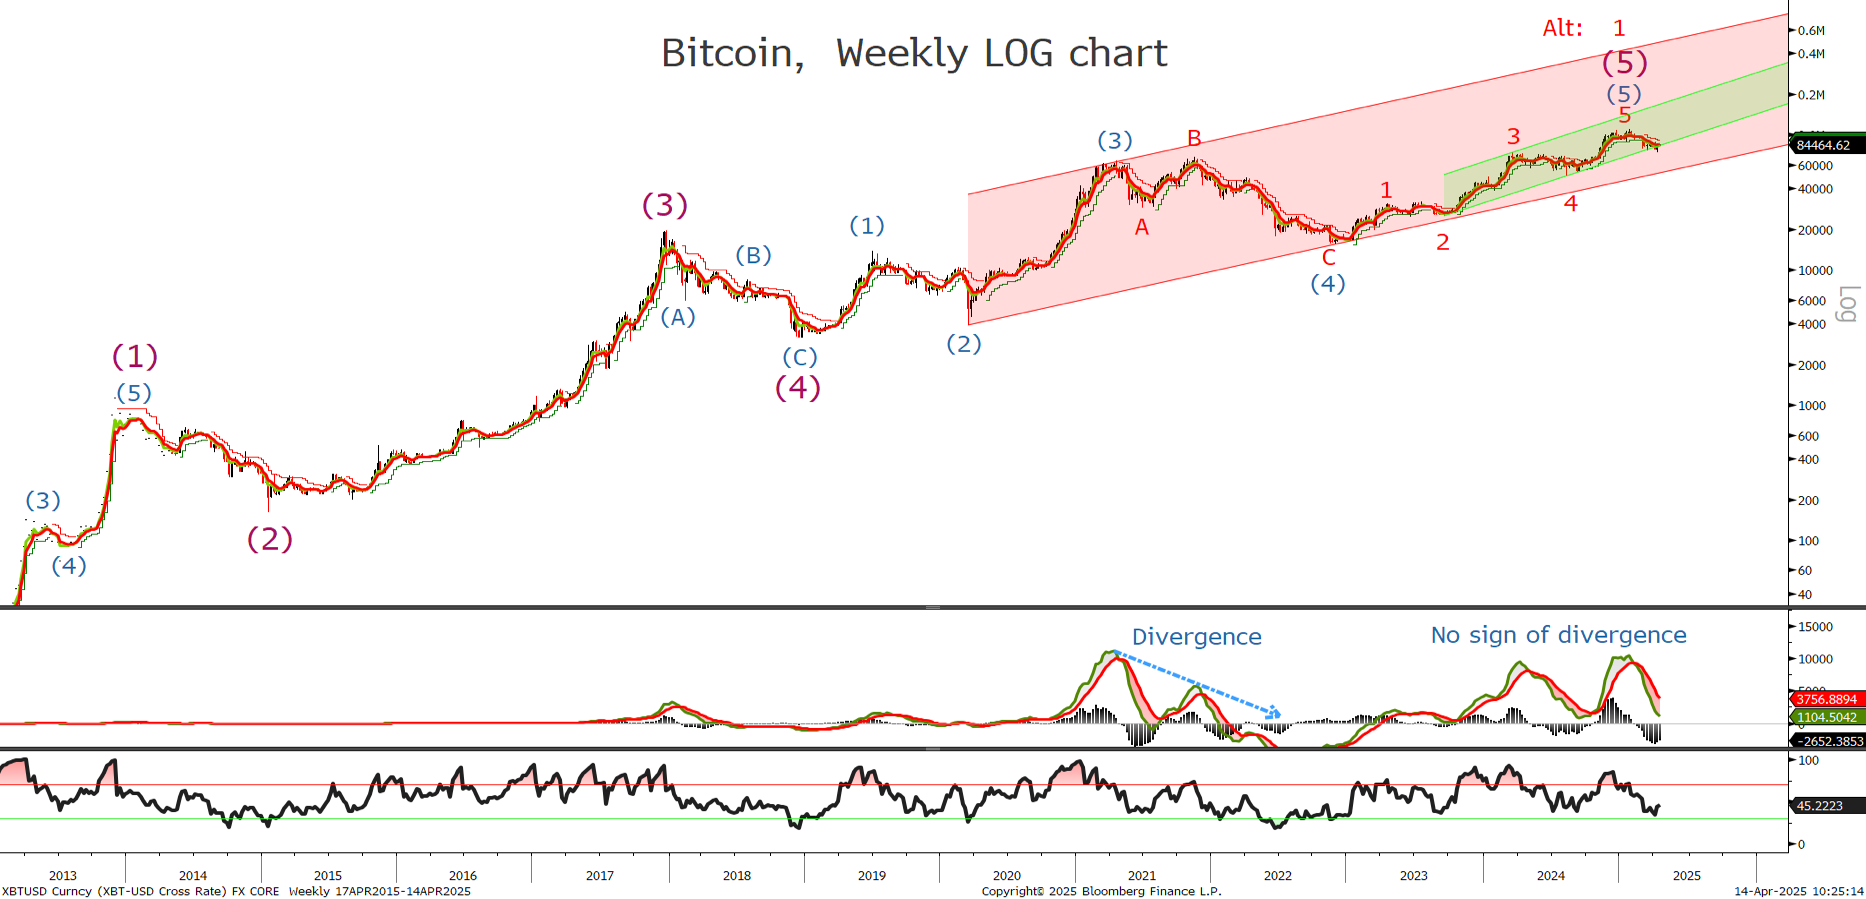
I am showing the weekly log chart here to reassess where we are with the cryptos . It look like we have completed either majoy wave (5) or minor wave 1 of wave (5). Given no sign of divergence lets look to the shorter periods for any clues.
Bitcoin long Term Chart
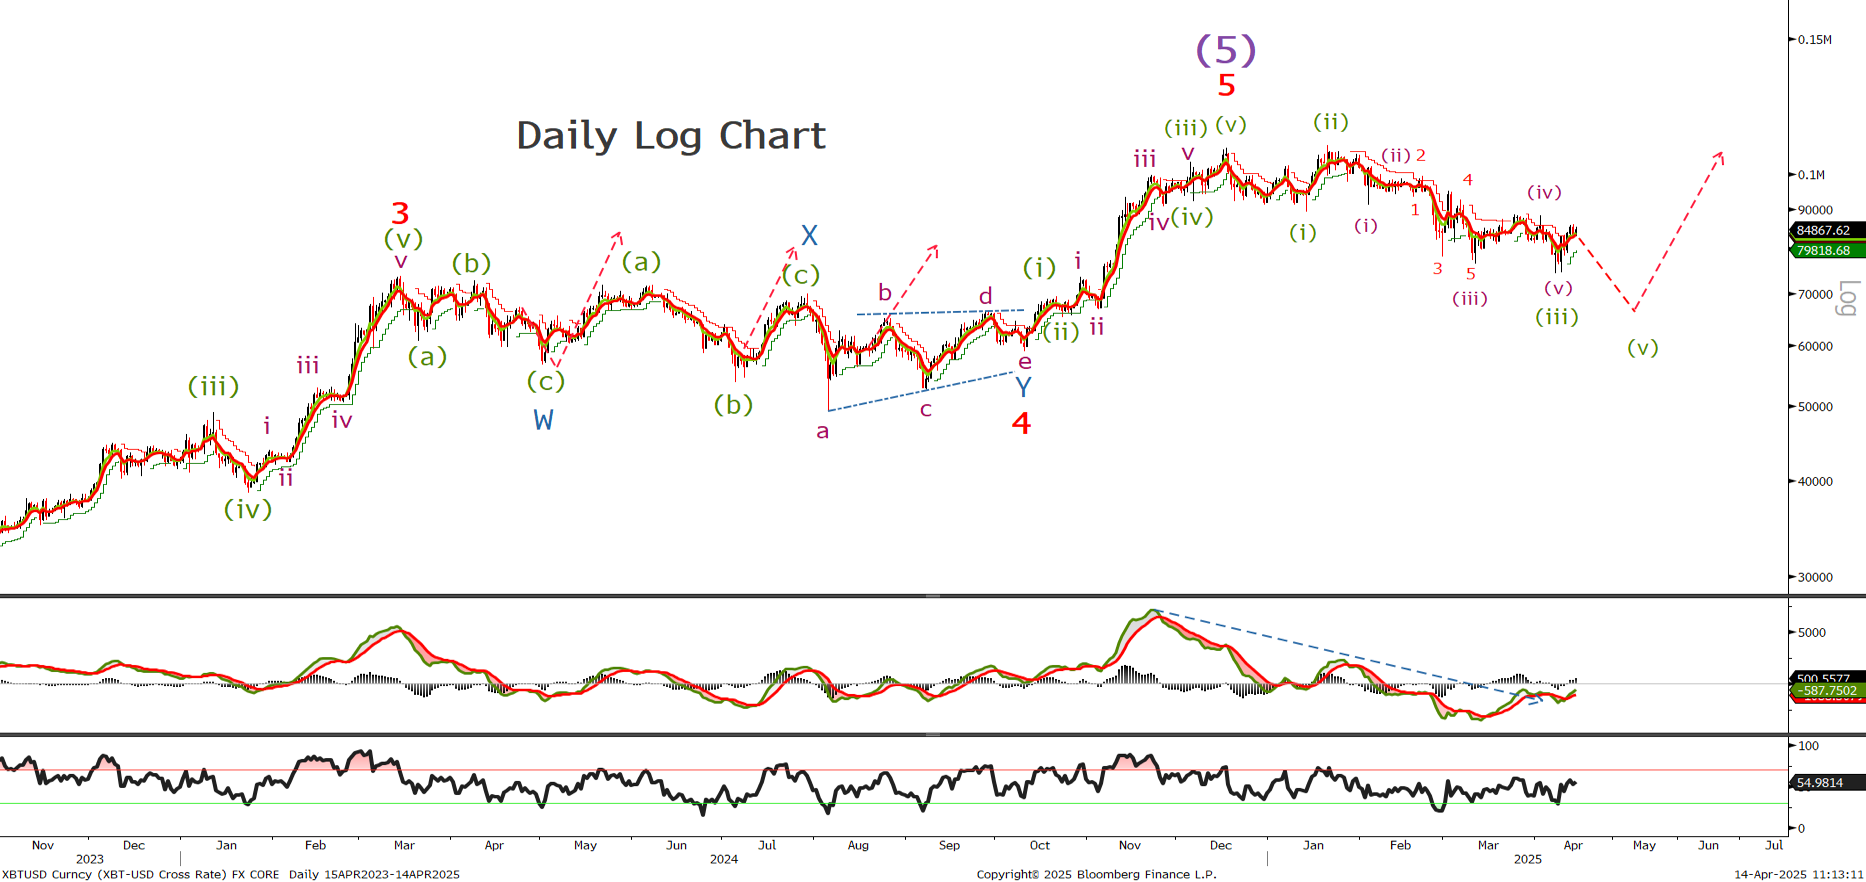
Last time we said ‘I have good support level around the 70555 area. A break below 69200 will not negate our bullish long term view but will call for lower BTC before the rally resumes.’ I have relabelled the chart showing BTC made its high back in December of this current leg up. Looking at the count we should have 1 more sell offto complete 5 waves down
Bitcoin Short Term Chart
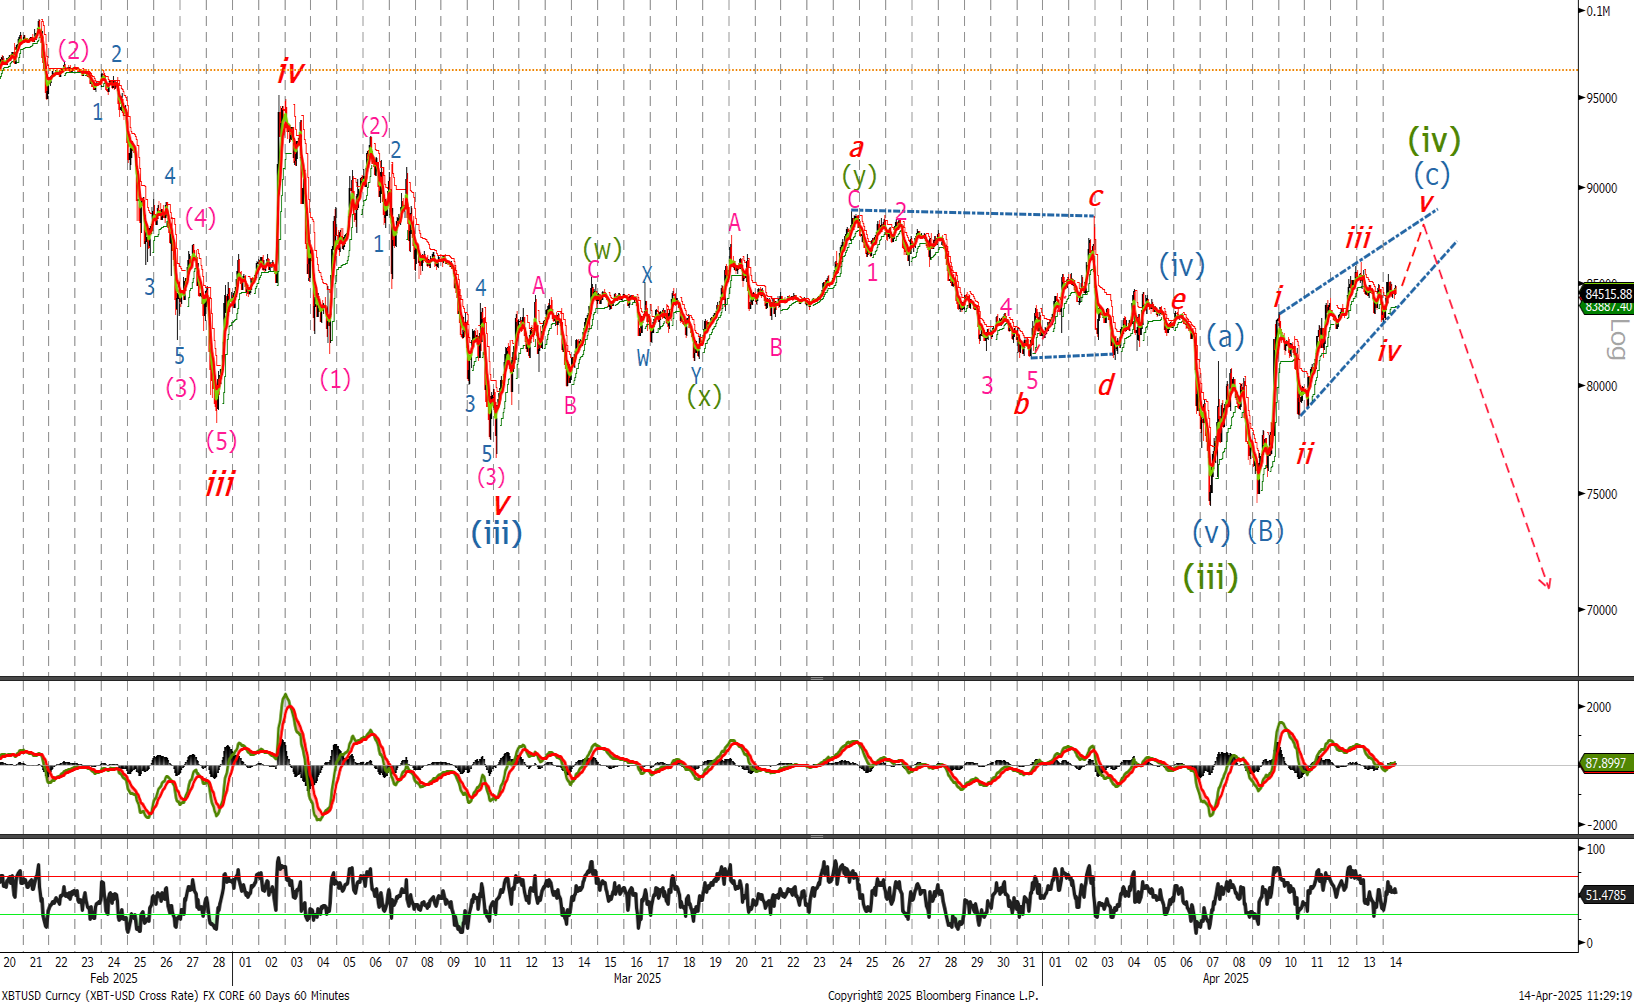
Last time we said ‘So we still expect to make at least 1 more new low and I would look to start buying in the 72000 and the 70282 and 69.5 k area. Wave v are often sharp and reverse quickly so if looking to buy make sure to place orders in the market. A move back above 84720 will signal the bullish trend has resumed.’ As I have relabelled the chart I would rather say now a move above 95200 confirm wave (v) is over and uptrend to resume. Looking at the chart I believe we have one more small push higher towards the 87750 level. I would look to sell there for moves to last weeks levels where I would look to buy back and go long. Stop and reverse above 85K now.
Ethereum Long Term Chart
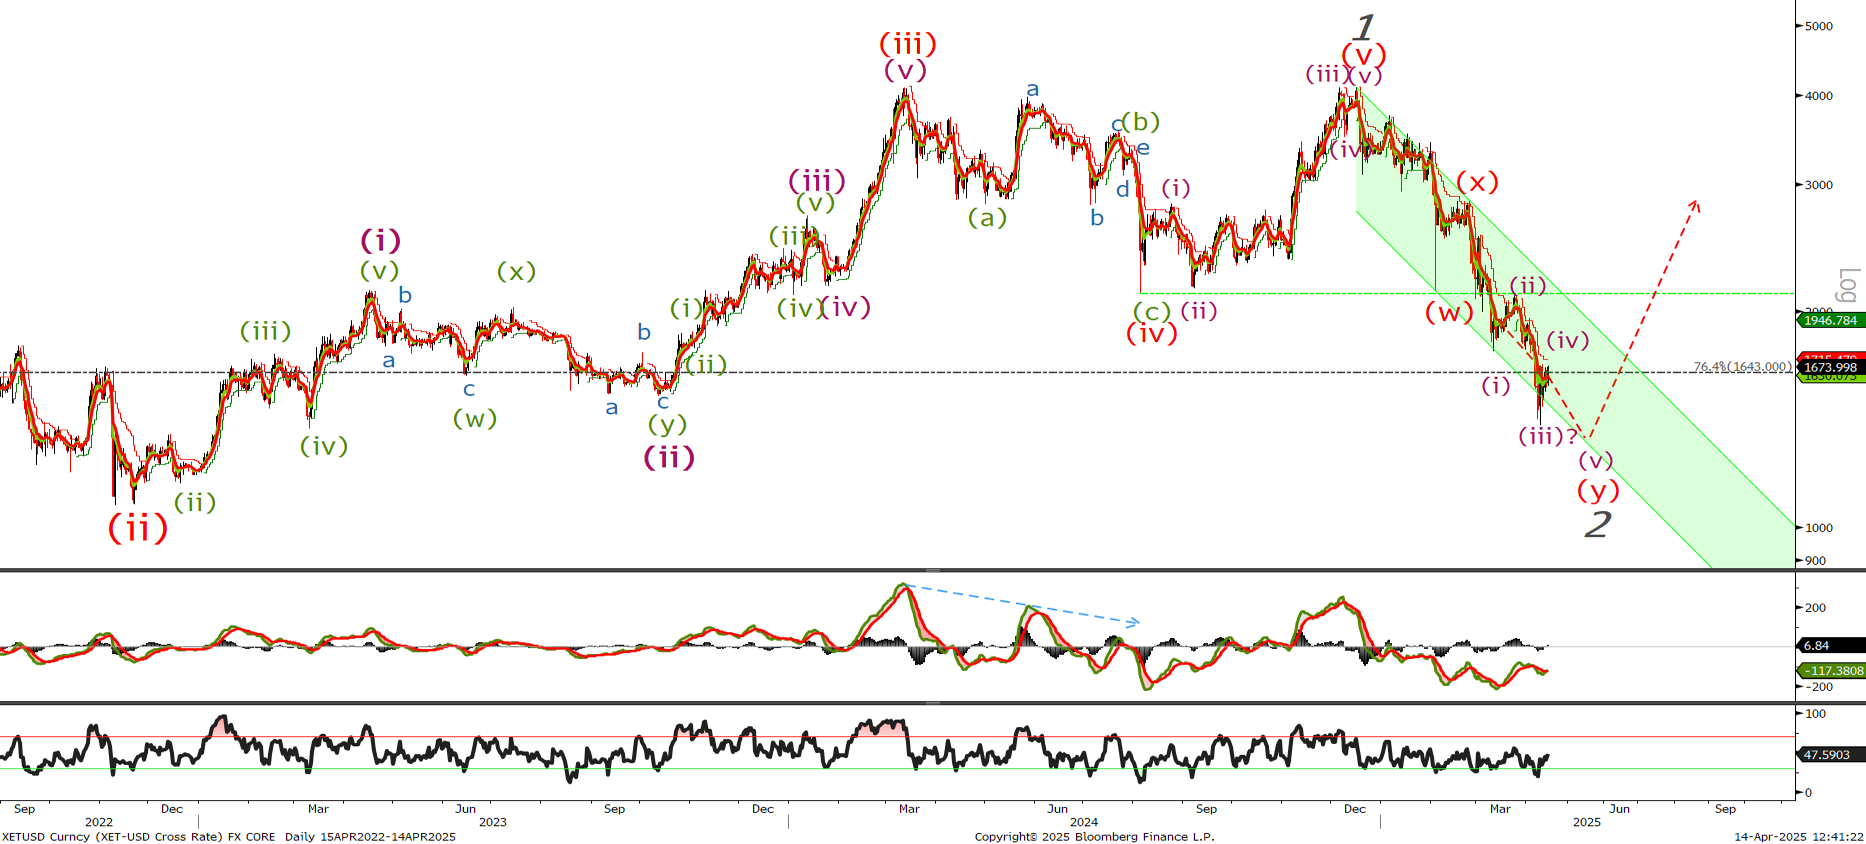
Now change to last weeks view ‘Looking at the Eth log long term chart we need to break as a minimum target the low from this month at 1756. I am not seeing any indication of a low so look to start buying ETH on a test of the 1643 76.4% retracement level.’ We are currently trading at 1624 so I am closing my long for small loss and will look to buy lower given we have yet to complete a 5 wave pattern to complete wave y’ We are looking for wave (iv) to complete. And are currently trading at 1675.
Ethereum Short Term Chart
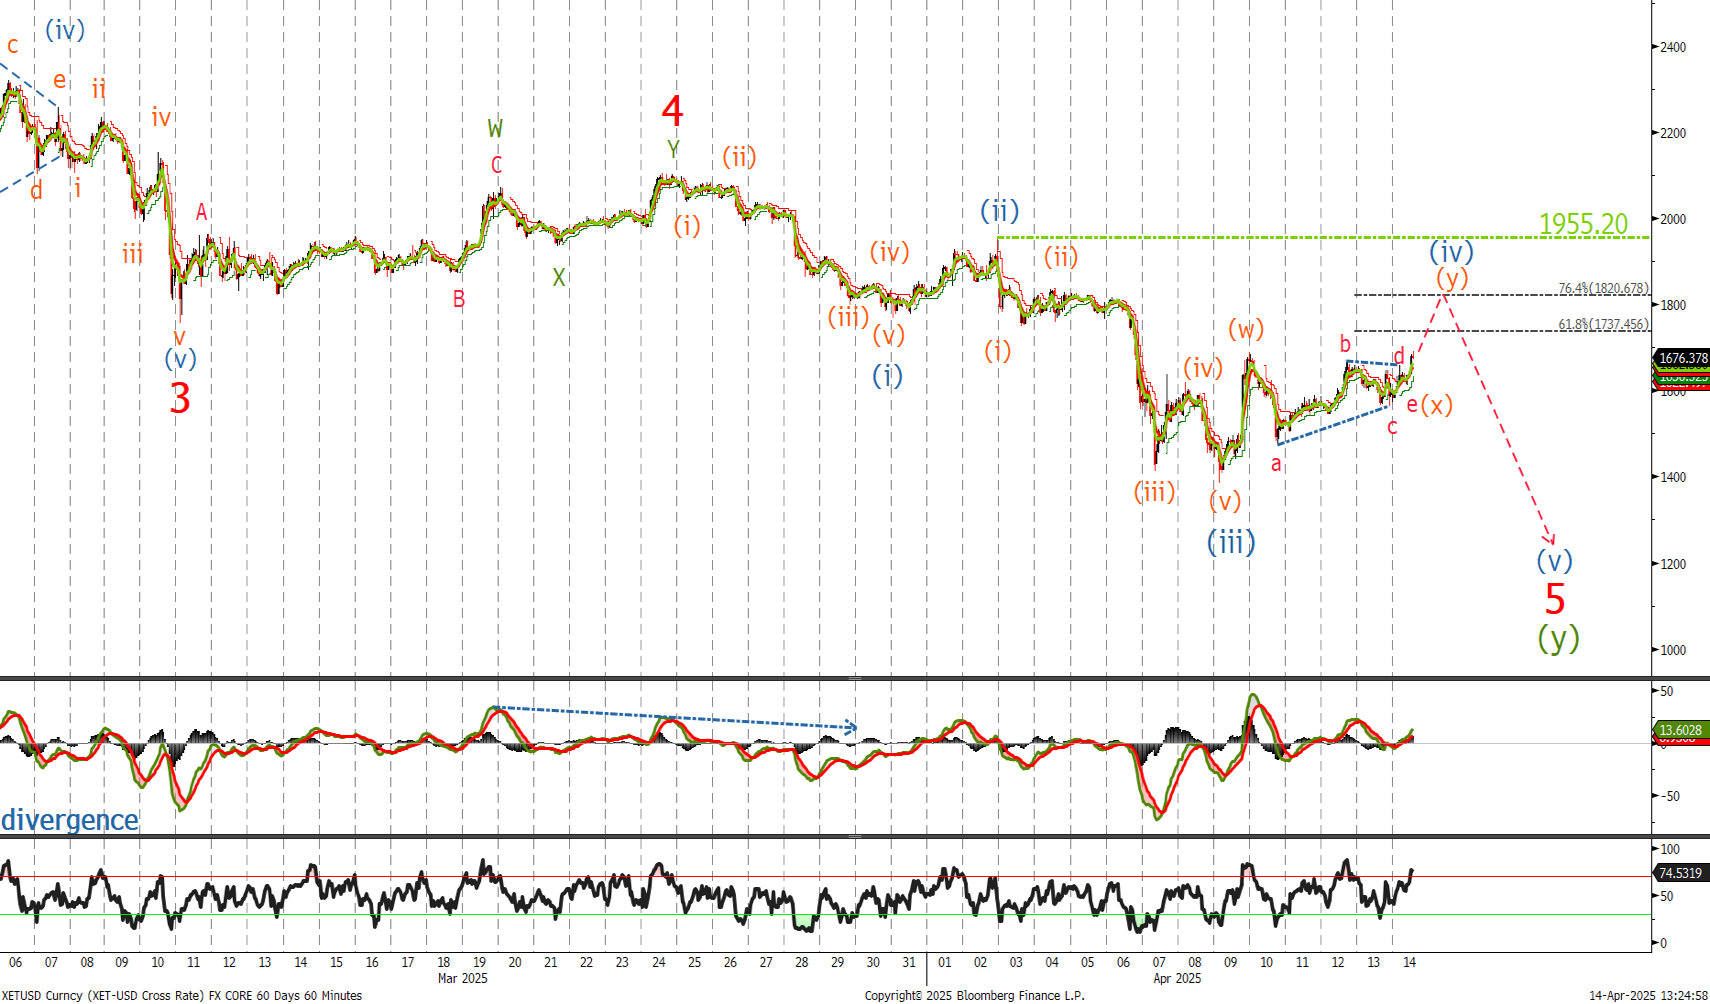
Looking at hourly we can see there has been no clear direction.- And it appears to me that we have just finished a corrective triangle for wave (x) that calls for another push higher to complete wave (iv)Look to sell at 1720 and again at 1820 with stops now above 1955.20. Looking for a push below the wave (iii) low at 1385.