Bitcoin Daily Chart
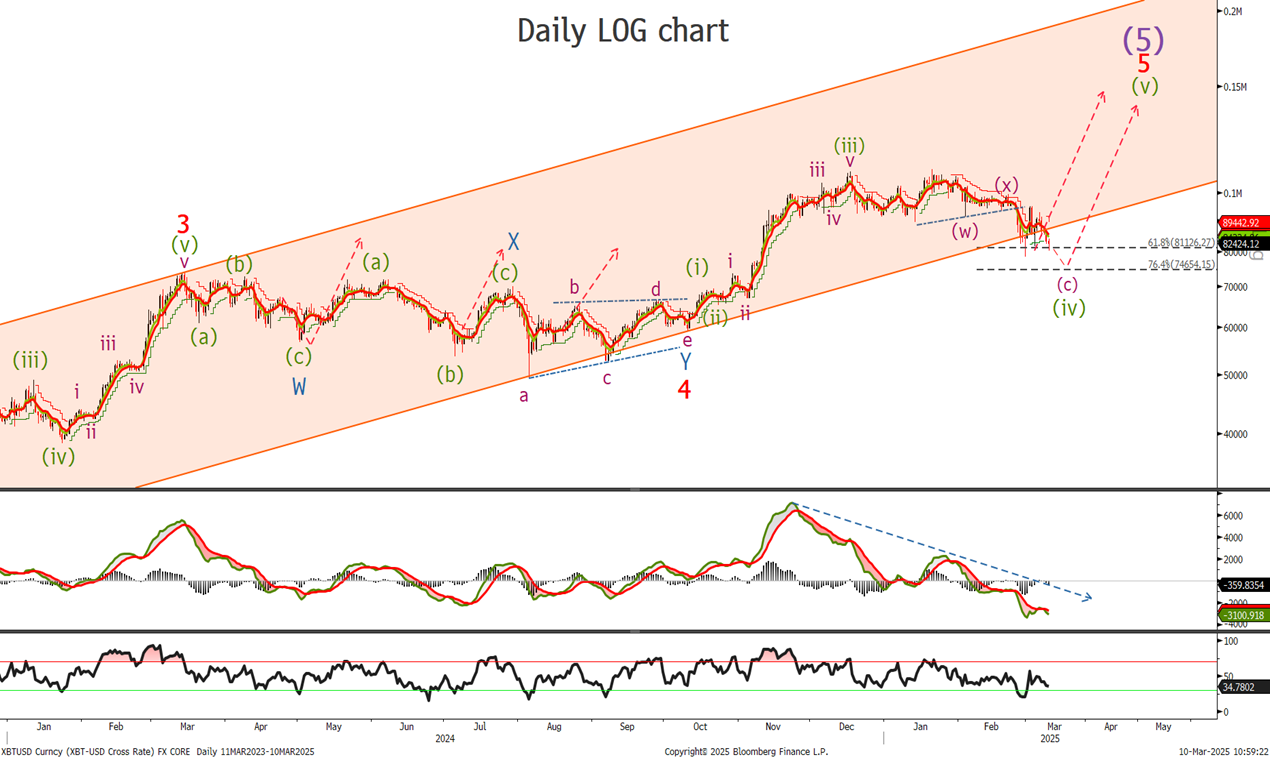
Last time we were looking ‘to see if we are close to ending what is now a wave (iv) correction.’
We haver pretty much trading in what appears to be a choppy corrective nature.
Lets look to the hourly chart to see where exactly we are and if the 76.4% retracement level is achievable at 74655.
Bitcoin Short Term Charts
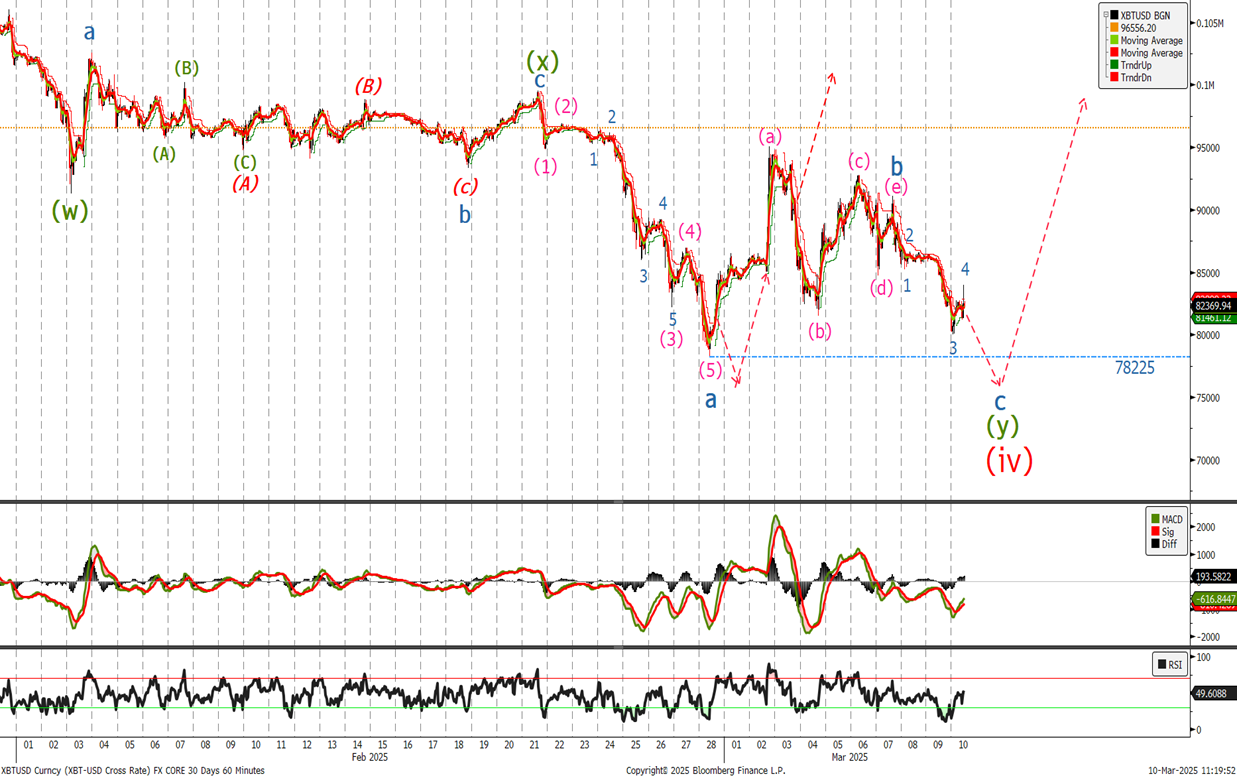
Last week we said ‘It looks in the short term we will push down one more time for a new low below 78225. I would use this level to start buying again. Place stops now at 69200 the wave (i) high on the previous chart.’
I changed the view following the sharp rally and was wrong calling the weave (iv) in to early. The previous view turned out to be the correct one and I can repeat it again
‘It looks in the short term we will push down one more time for a new low below 78225. I would use this level to start buying again. Place stops now at 69200 the wave (i) high on the previous chart.’ Add at 74650 stops at 69200.
Ethereum Daily Chart
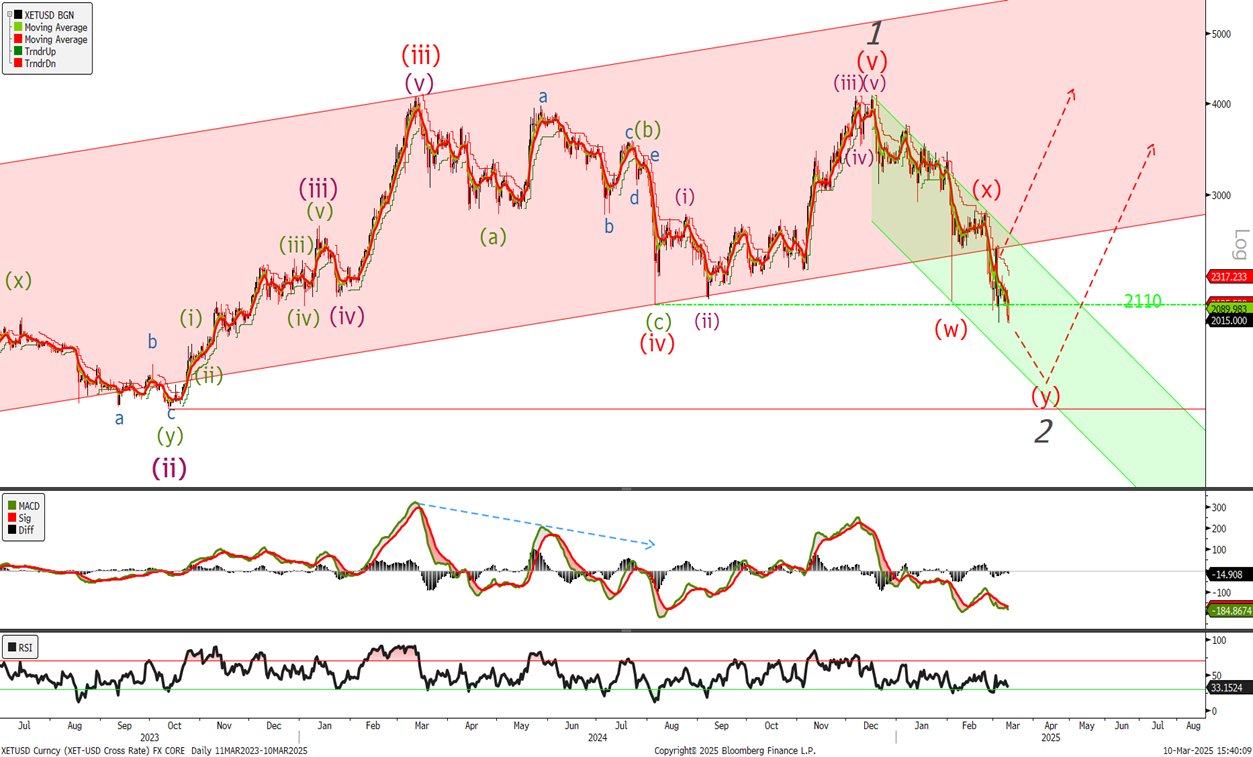
Last time we said ‘We were looking for ETH to trade lower so we could buy but having made its minimum target a new low it reversed quickly. I am buying now with stops below last weeks low. A daily close above 2900 will confirm that ETH is on the next leg to new highs.’
We traded lower the minute I sent the update and broke the 2074 low stopping us out. Lets look to the hourly to see possible lows.
Ethereum Short Term Chart
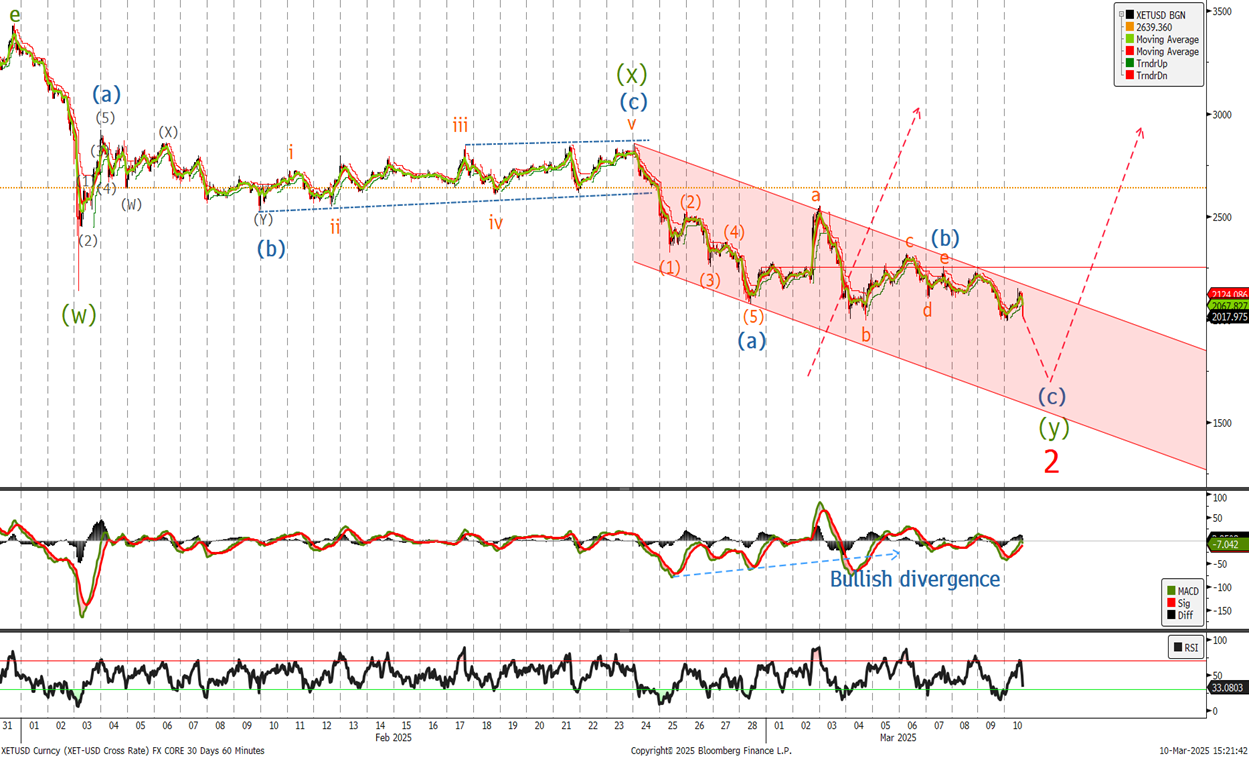
Last time we said ‘I am confident in calling a low in place and will use the 2000 level as my stop loss level. Looking at the short term count, and given the divergence in the MACD often the sign of as trend change. buy now at 2275 as I dont want to miss the move. On a risk reward basis if correct we should see a multi week rally whilst above 2000.’ Well i have changed the view and believe we should see a push down towards the 1900 1840 and 1750 level. We would look to buy at these levels . At 1480 wave (c) would equal wave (a) and we would look to buy down there as well although given the wave structure that does look far away.